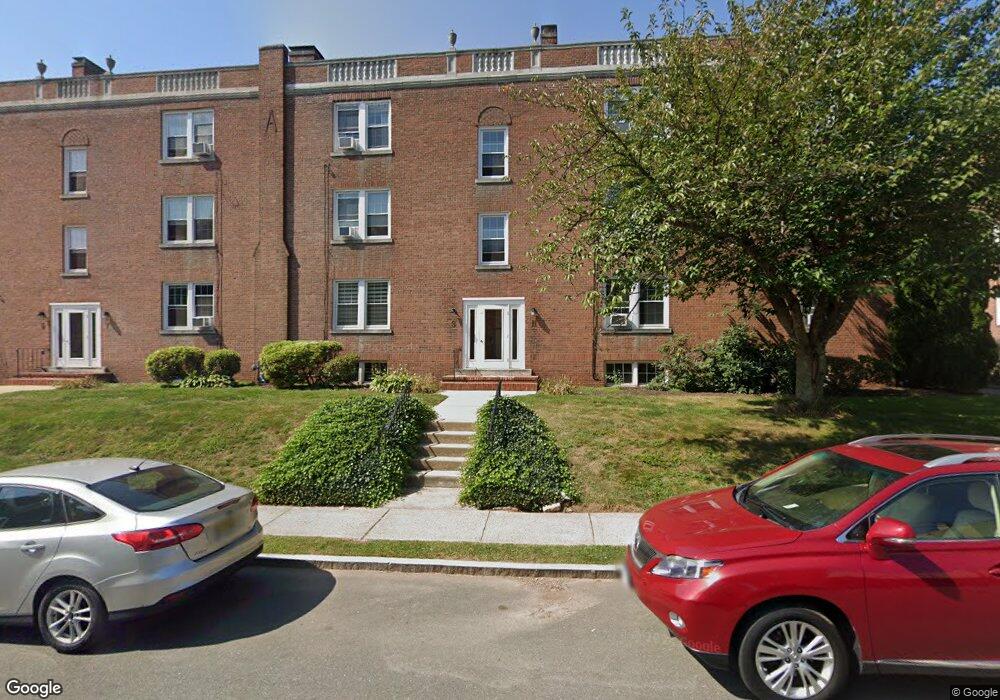
11 Robin Rd West Hartford, CT 06119
Estimated Value: $223,000 - $242,000
2
Beds
1
Bath
840
Sq Ft
$281/Sq Ft
Est. Value
About This Home
This home is located at 11 Robin Rd, West Hartford, CT 06119 and is currently estimated at $235,894, approximately $280 per square foot. 11 Robin Rd is a home located in Hartford County with nearby schools including Morley School, King Philip Middle School, and Hall High School.
Ownership History
Date
Name
Owned For
Owner Type
Purchase Details
Closed on
Feb 20, 2024
Sold by
Giles Doris L Est and Woods
Bought by
Isdale Jolene F
Current Estimated Value
Home Financials for this Owner
Home Financials are based on the most recent Mortgage that was taken out on this home.
Original Mortgage
$115,000
Outstanding Balance
$112,987
Interest Rate
6.66%
Mortgage Type
Purchase Money Mortgage
Estimated Equity
$122,907
Purchase Details
Closed on
Jul 11, 2022
Sold by
Backman Enterprises Llc
Bought by
Hasija Rohit and Dumeer Shifali
Purchase Details
Closed on
May 9, 2022
Sold by
Backman Enterprises Llc
Bought by
Kocienda Jonathan A and Kocienda Tammy H
Purchase Details
Closed on
Oct 2, 1997
Sold by
Citicorp Mortgage Inc
Bought by
Saucier Bruce A and Soucier Clayton R
Home Financials for this Owner
Home Financials are based on the most recent Mortgage that was taken out on this home.
Original Mortgage
$54,800
Interest Rate
9.25%
Mortgage Type
Purchase Money Mortgage
Create a Home Valuation Report for This Property
The Home Valuation Report is an in-depth analysis detailing your home's value as well as a comparison with similar homes in the area
Home Values in the Area
Average Home Value in this Area
Purchase History
| Date | Buyer | Sale Price | Title Company |
|---|---|---|---|
| Isdale Jolene F | $215,000 | None Available | |
| Hasija Rohit | $172,500 | None Available | |
| Kocienda Jonathan A | $175,000 | None Available | |
| Saucier Bruce A | $68,500 | -- |
Source: Public Records
Mortgage History
| Date | Status | Borrower | Loan Amount |
|---|---|---|---|
| Open | Isdale Jolene F | $115,000 | |
| Previous Owner | Saucier Bruce A | $125,600 | |
| Previous Owner | Saucier Bruce A | $53,500 | |
| Previous Owner | Saucier Bruce A | $53,600 | |
| Previous Owner | Saucier Bruce A | $54,800 |
Source: Public Records
Tax History Compared to Growth
Tax History
| Year | Tax Paid | Tax Assessment Tax Assessment Total Assessment is a certain percentage of the fair market value that is determined by local assessors to be the total taxable value of land and additions on the property. | Land | Improvement |
|---|---|---|---|---|
| 2025 | $5,022 | $112,140 | $0 | $112,140 |
| 2024 | $4,749 | $112,140 | $0 | $112,140 |
| 2023 | $4,589 | $112,140 | $0 | $112,140 |
| 2022 | $4,562 | $112,140 | $0 | $112,140 |
| 2021 | $4,546 | $107,170 | $0 | $107,170 |
| 2020 | $4,436 | $106,120 | $0 | $106,120 |
| 2019 | $4,436 | $106,120 | $0 | $106,120 |
| 2018 | $4,351 | $106,120 | $0 | $106,120 |
| 2017 | $4,355 | $106,120 | $0 | $106,120 |
| 2016 | $4,309 | $109,060 | $0 | $109,060 |
| 2015 | $4,178 | $109,060 | $0 | $109,060 |
| 2014 | $3,892 | $104,160 | $0 | $104,160 |
Source: Public Records
Map
Nearby Homes
- 869 Farmington Ave Unit 305
- 54 Robin Rd Unit B2
- 30 Outlook Ave Unit 205
- 1006A Trout Brook Dr Unit 1006A
- 1110 Trout Brook Dr
- 105 Ardmore Rd
- 183 Loomis Dr Unit 109
- 85 Memorial Rd Unit 512
- 16 Lilley Rd
- 1196 Trout Brook Dr
- 2 Arapahoe Rd Unit 313
- 2 Arapahoe Rd Unit 308
- 2 Arapahoe Rd Unit 611
- 2 Arapahoe Rd Unit 601
- 2 Arapahoe Rd Unit 510
- 2 Arapahoe Rd Unit 505
- 2 Arapahoe Rd Unit 604
- 2 Arapahoe Rd Unit 609
- 2 Arapahoe Rd Unit 607
- 2 Arapahoe Rd Unit 312
- 11 Robin Rd Unit B
- 11 Robin Rd Unit A
- 11 Robin Rd Unit 11B
- 5 Robin Rd Unit B
- 5 Robin Rd Unit A
- 5 Robin Rd
- 5 Robin Rd Unit 5B
- 5 Robin Rd Unit 2A
- 5 Robin Rd Unit 5
- 5 Robin Rd Unit 5A
- 5 Robin Rd Unit c
- 5A Robin Rd Unit 5A
- 18 Robin Rd Unit 6
- 18 Robin Rd Unit 5
- 18 Robin Rd Unit 4
- 18 Robin Rd Unit 3
- 18 Robin Rd Unit 2
- 21 Robin Rd Unit C1
- 21 Robin Rd Unit B1
- 21 Robin Rd Unit A1