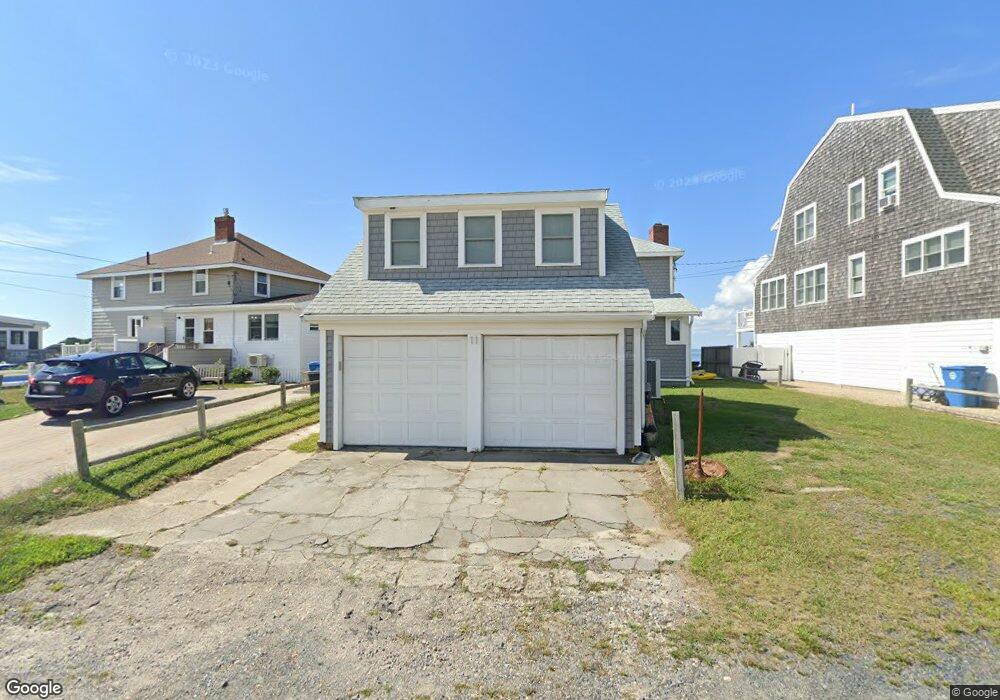
11 Rock St North Falmouth, MA 02556
North Falmouth NeighborhoodEstimated Value: $1,357,000 - $2,111,979
4
Beds
3
Baths
1,801
Sq Ft
$925/Sq Ft
Est. Value
About This Home
This home is located at 11 Rock St, North Falmouth, MA 02556 and is currently estimated at $1,665,245, approximately $924 per square foot. 11 Rock St is a home located in Barnstable County with nearby schools including North Falmouth Elementary School, Morse Pond School, and Lawrence School.
Ownership History
Date
Name
Owned For
Owner Type
Purchase Details
Closed on
Aug 6, 2019
Sold by
Duggan Catherine A
Bought by
Duggan Falmouth T and Duggan D
Current Estimated Value
Purchase Details
Closed on
Sep 18, 1997
Sold by
Flynn Paul P and Flynn Sandra M
Bought by
Duggan Catherine A
Purchase Details
Closed on
Jun 25, 1990
Sold by
Perkit Joyce
Bought by
Stavker Services Inc
Create a Home Valuation Report for This Property
The Home Valuation Report is an in-depth analysis detailing your home's value as well as a comparison with similar homes in the area
Home Values in the Area
Average Home Value in this Area
Purchase History
| Date | Buyer | Sale Price | Title Company |
|---|---|---|---|
| Duggan Falmouth T | -- | -- | |
| Duggan Falmouth T | -- | -- | |
| Duggan Catherine A | $320,000 | -- | |
| Duggan Catherine A | $320,000 | -- | |
| Stavker Services Inc | $350,000 | -- |
Source: Public Records
Tax History Compared to Growth
Tax History
| Year | Tax Paid | Tax Assessment Tax Assessment Total Assessment is a certain percentage of the fair market value that is determined by local assessors to be the total taxable value of land and additions on the property. | Land | Improvement |
|---|---|---|---|---|
| 2025 | $12,370 | $2,107,300 | $1,680,200 | $427,100 |
| 2024 | $12,119 | $1,929,700 | $1,540,200 | $389,500 |
| 2023 | $11,986 | $1,732,100 | $1,400,200 | $331,900 |
| 2022 | $11,582 | $1,438,800 | $1,168,100 | $270,700 |
| 2021 | $11,539 | $1,357,500 | $1,117,300 | $240,200 |
| 2020 | $10,788 | $1,255,900 | $1,015,700 | $240,200 |
| 2019 | $10,736 | $1,254,200 | $1,015,700 | $238,500 |
| 2018 | $10,823 | $1,237,800 | $1,015,700 | $222,100 |
| 2017 | $10,471 | $1,227,600 | $1,015,700 | $211,900 |
| 2016 | $9,720 | $1,161,300 | $1,015,700 | $145,600 |
| 2015 | $9,511 | $1,161,300 | $1,015,700 | $145,600 |
| 2014 | $9,463 | $1,161,100 | $1,015,600 | $145,500 |
Source: Public Records
Map
Nearby Homes
- 74 Hillside Ave
- 24 Westwood Rd
- 40 Point Rd
- 9 Seascape Ln
- 37 Five Gate Ln
- 14 Ryder Rd
- 24 Fiddlers Cove Rd
- 0 Quaker Rd Unit 22504204
- 0 Quaker Rd Unit 73423088
- 345 Quaker Rd
- 2 Tricia Rd
- 267 N Falmouth Hwy
- 213 N Falmouth Hwy Unit 5A
- 213 N Falmouth Hwy Unit 5B
- 213 N Falmouth Hwy Unit 5 A
- 104 Streeter Hill Rd
- 104 Streeter Hill Rd
- 37 Nemasket Rd
- 37 Nemsaket Rd
- 121 Streeter Hill Rd
- 9 Rock St
- 15 Rock St
- 5 Rock St
- 10 Rock St
- 10 Rock St
- 12 Rock St
- 21 Rock St
- 8 Rock St
- 160 Silver Beach Ave
- 6 Rock St
- 156 Silver Beach Ave
- 148 Silver Beach Ave
- 146 Silver Beach Ave
- 159 Silver Beach Ave
- 142 Silver Beach Ave
- 28 Moses Rd
- 153 Silver Beach Ave
- 140 Silver Beach Ave
- 25 Moses Rd
- 151 Silver Beach Ave