
Seller's Agent in 2025
Andrea Feeney
Keller Williams Realty Colonial Partners
2 in this area
2 Total Sales
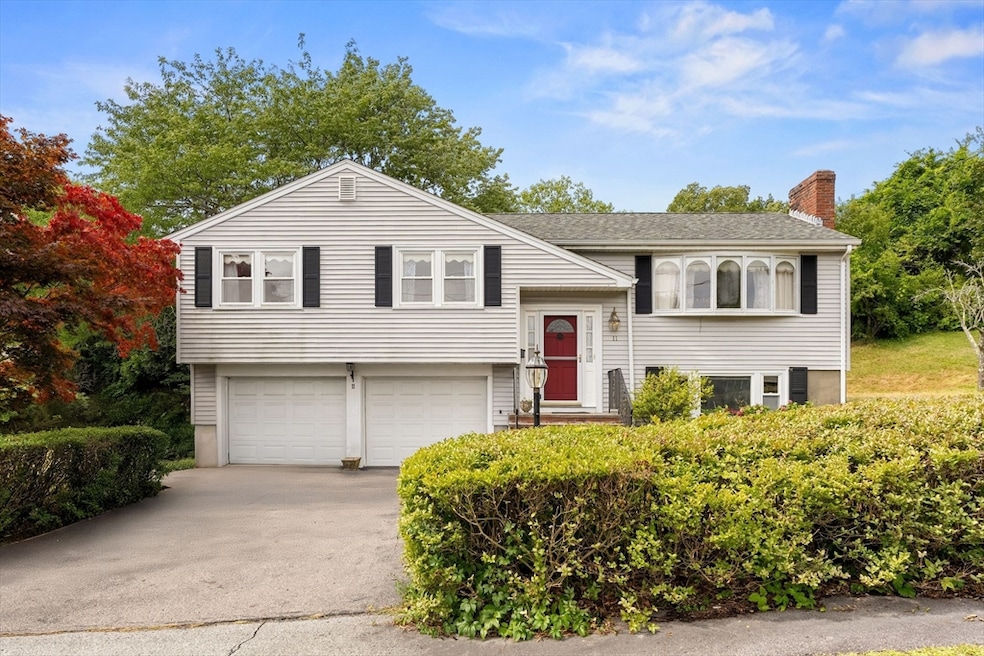
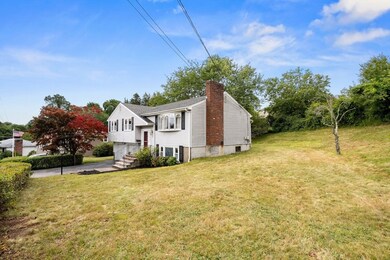
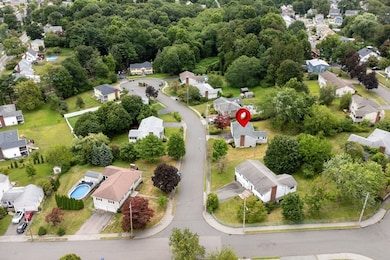

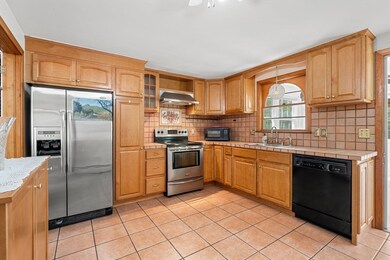
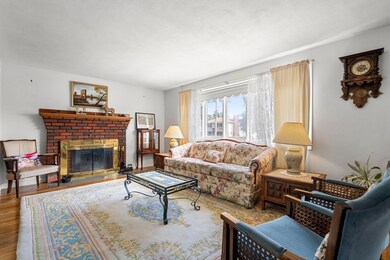
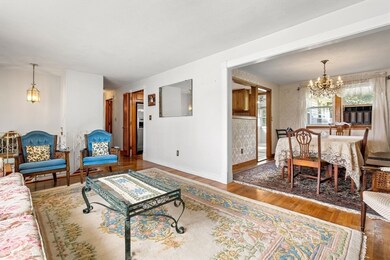
Quincy/Braintree Line! Located in the desirable Penn's Hill area of Braintree. This spacious 3 bedroom, 1.5 bath is tucked away on a quiet cul-de-sac. This home leaves you just minutes to highway access, MBTA transportation, schools, shopping, restaurants, emergency services and more. The main floor showcases a large living room with fireplace, dining room and ~12 year young kitchen and newer appliances. Here you will also find a generously sized flex-space sunroom that can be used as an office or den. Down the hallway you will find 3 good sized bedrooms, and a spacious, updated bathroom. On the lower level find a bonus room with a fireplace, laundry room and a half bathroom! The attached 2 car garage makes for easy access. The back deck and spacious back yard complete this property – perfect for outdoor New England living. Roof approx. 7 years old. Boiler replaced 2021. You don’t want to miss this one!
Last Agent to Sell the Property
Keller Williams Realty Colonial Partners Listed on: 08/26/2025
| Date | Type | Sale Price | Title Company |
|---|---|---|---|
| Quit Claim Deed | $710,000 | -- | |
| Quit Claim Deed | -- | None Available | |
| Land Court Massachusetts | $410,000 | -- | |
| Land Court Massachusetts | $410,000 | -- |
| Date | Status | Loan Amount | Loan Type |
|---|---|---|---|
| Open | $497,000 | Purchase Money Mortgage | |
| Previous Owner | $110,000 | No Value Available | |
| Previous Owner | $174,000 | No Value Available | |
| Previous Owner | $180,000 | Purchase Money Mortgage |
| Date | Event | Price | List to Sale | Price per Sq Ft |
|---|---|---|---|---|
| 10/30/2025 10/30/25 | Sold | $710,000 | -3.9% | $396 / Sq Ft |
| 09/19/2025 09/19/25 | Pending | -- | -- | -- |
| 09/10/2025 09/10/25 | Price Changed | $739,000 | -1.3% | $412 / Sq Ft |
| 08/26/2025 08/26/25 | For Sale | $749,000 | -- | $418 / Sq Ft |
| Year | Tax Paid | Tax Assessment Tax Assessment Total Assessment is a certain percentage of the fair market value that is determined by local assessors to be the total taxable value of land and additions on the property. | Land | Improvement |
|---|---|---|---|---|
| 2025 | $6,897 | $691,100 | $405,000 | $286,100 |
| 2024 | $6,152 | $648,900 | $373,000 | $275,900 |
| 2023 | $5,865 | $600,900 | $341,100 | $259,800 |
| 2022 | $5,554 | $558,200 | $298,400 | $259,800 |
| 2021 | $5,188 | $521,400 | $269,600 | $251,800 |
| 2020 | $4,899 | $496,900 | $245,100 | $251,800 |
| 2019 | $4,798 | $475,500 | $245,100 | $230,400 |
| 2018 | $4,572 | $433,800 | $213,200 | $220,600 |
| 2017 | $4,421 | $411,600 | $202,500 | $209,100 |
| 2016 | $4,329 | $394,300 | $191,800 | $202,500 |
| 2015 | $4,300 | $388,400 | $187,600 | $200,800 |
| 2014 | $3,910 | $342,400 | $163,100 | $179,300 |
Seller's Agent in 2025
Andrea Feeney
Keller Williams Realty Colonial Partners
2 in this area
2 Total Sales
E
Buyer's Agent in 2025
Ermal Taraj
Cameron Real Estate Group - Framingham
(617) 888-1744
1 in this area
20 Total Sales
Source: MLS Property Information Network (MLS PIN)
MLS Number: 73422229
APN: BRAI-002079A-000000-000016
Disclaimer: Certain information contained herein is derived from information provided by parties other than Homes.com. All information provided is deemed reliable, but is not guaranteed to be accurate and should be independently verified.
![]() The property listing data and information, or the Images, set forth herein were provided to MLS Property Information Network, Inc. from third party sources, including sellers, lessors and public records, and were compiled by MLS Property Information Network, Inc. The property listing data and information, and the Images, are for the personal, non-commercial use of consumers having a good faith interest in purchasing or leasing listed properties of the type displayed to them and may not be used for any purpose other than to identify prospective properties which such consumers may have a good faith interest in purchasing or leasing. MLS Property Information Network, Inc. and its subscribers disclaim any and all representations and warranties as to the accuracy of the property listing data and information, or as to the accuracy of any of the Images, set forth herein.
The property listing data and information, or the Images, set forth herein were provided to MLS Property Information Network, Inc. from third party sources, including sellers, lessors and public records, and were compiled by MLS Property Information Network, Inc. The property listing data and information, and the Images, are for the personal, non-commercial use of consumers having a good faith interest in purchasing or leasing listed properties of the type displayed to them and may not be used for any purpose other than to identify prospective properties which such consumers may have a good faith interest in purchasing or leasing. MLS Property Information Network, Inc. and its subscribers disclaim any and all representations and warranties as to the accuracy of the property listing data and information, or as to the accuracy of any of the Images, set forth herein.