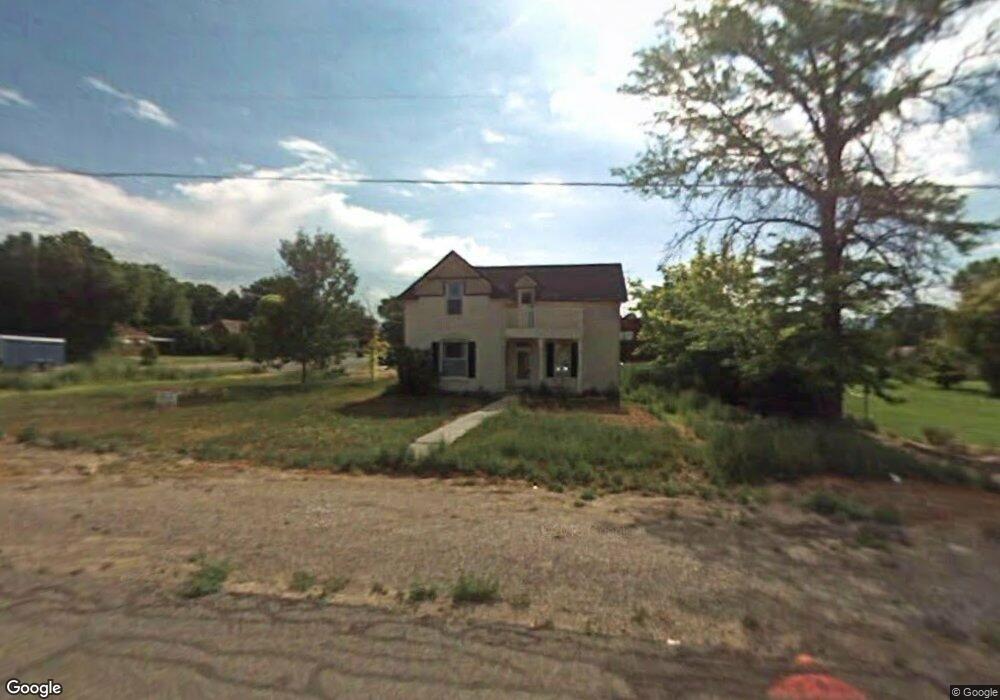
11 S 100 E Gunnison, UT 84634
Gunnison NeighborhoodEstimated Value: $269,000 - $321,000
4
Beds
2
Baths
1,460
Sq Ft
$198/Sq Ft
Est. Value
About This Home
This home is located at 11 S 100 E, Gunnison, UT 84634 and is currently estimated at $289,704, approximately $198 per square foot. 11 S 100 E is a home located in Sanpete County.
Ownership History
Date
Name
Owned For
Owner Type
Purchase Details
Closed on
Oct 5, 2018
Sold by
Kris Jorgensen
Bought by
Kaplan Jeffery K
Current Estimated Value
Home Financials for this Owner
Home Financials are based on the most recent Mortgage that was taken out on this home.
Original Mortgage
$152,484
Outstanding Balance
$131,873
Interest Rate
4.12%
Mortgage Type
FHA
Estimated Equity
$157,831
Purchase Details
Closed on
Jun 1, 2007
Sold by
Us Bank National Association
Bought by
Jorgensen Kris
Purchase Details
Closed on
Jun 22, 2005
Sold by
Penny Paul Vaughn and Penny Paul
Bought by
Jeppson Peter J
Create a Home Valuation Report for This Property
The Home Valuation Report is an in-depth analysis detailing your home's value as well as a comparison with similar homes in the area
Home Values in the Area
Average Home Value in this Area
Purchase History
| Date | Buyer | Sale Price | Title Company |
|---|---|---|---|
| Kaplan Jeffery K | $190,605 | Us Title Ins Agcy | |
| Jorgensen Kris | -- | -- | |
| Jeppson Peter J | -- | -- |
Source: Public Records
Mortgage History
| Date | Status | Borrower | Loan Amount |
|---|---|---|---|
| Open | Kaplan Jeffery K | $152,484 |
Source: Public Records
Tax History Compared to Growth
Tax History
| Year | Tax Paid | Tax Assessment Tax Assessment Total Assessment is a certain percentage of the fair market value that is determined by local assessors to be the total taxable value of land and additions on the property. | Land | Improvement |
|---|---|---|---|---|
| 2024 | $1,303 | $118,091 | $0 | $0 |
| 2023 | $1,380 | $116,729 | $0 | $0 |
| 2022 | $1,334 | $104,223 | $0 | $0 |
| 2021 | $1,262 | $85,217 | $0 | $0 |
| 2020 | $1,179 | $74,672 | $0 | $0 |
| 2019 | $1,123 | $69,409 | $0 | $0 |
| 2018 | $932 | $99,505 | $19,470 | $80,035 |
| 2017 | $884 | $54,728 | $0 | $0 |
| 2016 | $835 | $51,658 | $0 | $0 |
| 2015 | $836 | $51,658 | $0 | $0 |
| 2014 | $823 | $51,658 | $0 | $0 |
| 2013 | $852 | $53,621 | $0 | $0 |
Source: Public Records
Map
Nearby Homes