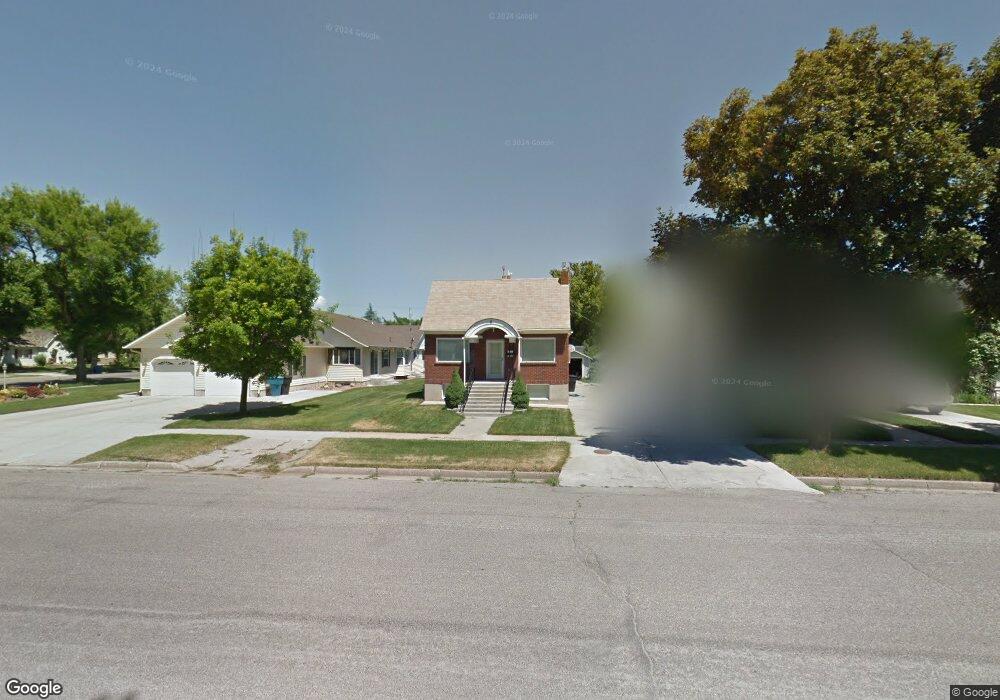
11 S 2nd E Preston, ID 83263
Estimated Value: $337,000 - $357,000
3
Beds
2
Baths
2,236
Sq Ft
$154/Sq Ft
Est. Value
About This Home
This home is located at 11 S 2nd E, Preston, ID 83263 and is currently estimated at $343,603, approximately $153 per square foot. 11 S 2nd E is a home located in Franklin County with nearby schools including Pioneer Elementary School, Oakwood Elementary School, and Preston Junior High School.
Ownership History
Date
Name
Owned For
Owner Type
Purchase Details
Closed on
Jun 17, 2019
Sold by
Vandyriff Mark and Vandygriff Amanda
Bought by
Bell Cheryl
Current Estimated Value
Home Financials for this Owner
Home Financials are based on the most recent Mortgage that was taken out on this home.
Original Mortgage
$181,818
Outstanding Balance
$159,862
Interest Rate
4.1%
Mortgage Type
New Conventional
Estimated Equity
$183,741
Purchase Details
Closed on
Dec 12, 2018
Sold by
Bowen Wendy G and Bowen Casey L
Bought by
Vandygriff Mark and Vandygriff Amanda
Home Financials for this Owner
Home Financials are based on the most recent Mortgage that was taken out on this home.
Original Mortgage
$120,000
Interest Rate
4.8%
Mortgage Type
New Conventional
Purchase Details
Closed on
Feb 23, 2015
Sold by
Sagers Stewart L
Bought by
Franklin County
Create a Home Valuation Report for This Property
The Home Valuation Report is an in-depth analysis detailing your home's value as well as a comparison with similar homes in the area
Home Values in the Area
Average Home Value in this Area
Purchase History
| Date | Buyer | Sale Price | Title Company |
|---|---|---|---|
| Bell Cheryl | -- | Northern Title | |
| Vandygriff Mark | -- | Northern Title | |
| Franklin County | -- | None Available |
Source: Public Records
Mortgage History
| Date | Status | Borrower | Loan Amount |
|---|---|---|---|
| Open | Bell Cheryl | $181,818 | |
| Previous Owner | Vandygriff Mark | $120,000 |
Source: Public Records
Tax History
| Year | Tax Paid | Tax Assessment Tax Assessment Total Assessment is a certain percentage of the fair market value that is determined by local assessors to be the total taxable value of land and additions on the property. | Land | Improvement |
|---|---|---|---|---|
| 2025 | $1,359 | $302,281 | $60,000 | $242,281 |
| 2024 | $1,423 | $302,281 | $60,000 | $242,281 |
| 2023 | $1,335 | $304,990 | $60,000 | $244,990 |
| 2022 | $1,845 | $304,102 | $20,992 | $283,110 |
| 2021 | $1,321 | $211,594 | $20,992 | $190,602 |
| 2019 | $1,518 | $102,859 | $20,992 | $81,867 |
| 2018 | $1,574 | $102,888 | $19,520 | $83,368 |
| 2017 | $1,517 | $102,888 | $19,520 | $83,368 |
| 2016 | $461 | $78,830 | $19,520 | $59,310 |
| 2015 | $18,184 | $78,830 | $19,520 | $59,310 |
| 2014 | $11,368 | $78,830 | $19,520 | $59,310 |
| 2013 | $9,746 | $78,830 | $19,520 | $59,310 |
Source: Public Records
Map
Nearby Homes
Your Personal Tour Guide
Ask me questions while you tour the home.