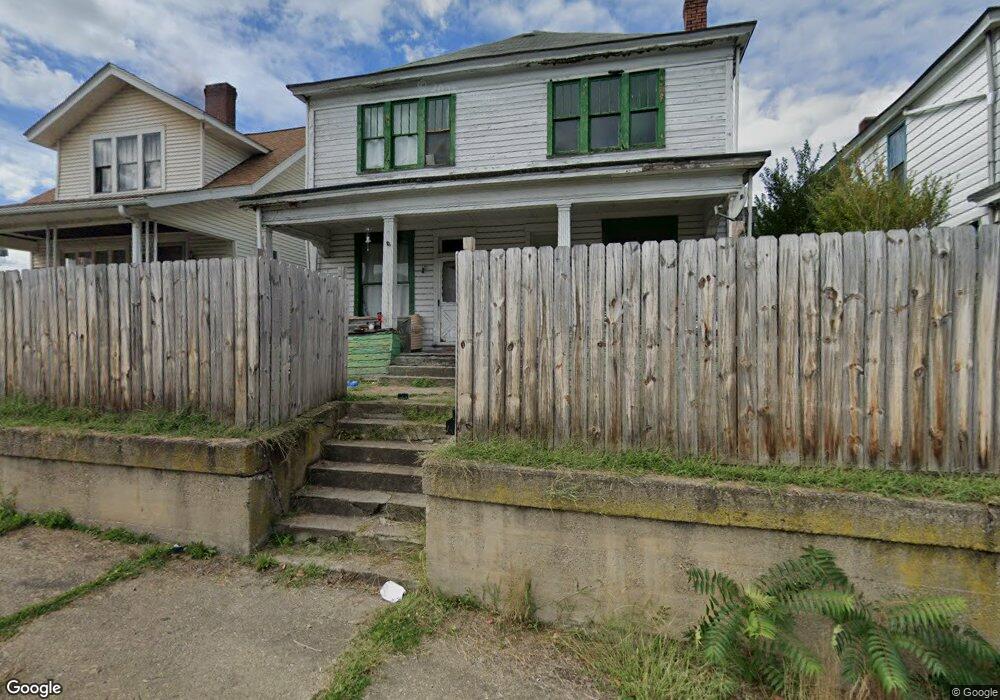
11 S 3rd St Martins Ferry, OH 43935
Estimated Value: $90,000 - $135,000
5
Beds
3
Baths
3,072
Sq Ft
$36/Sq Ft
Est. Value
About This Home
This home is located at 11 S 3rd St, Martins Ferry, OH 43935 and is currently estimated at $111,667, approximately $36 per square foot. 11 S 3rd St is a home located in Belmont County with nearby schools including Anna Marie Ayers Elementary School, Martins Ferry Middle School, and Martins Ferry High School.
Ownership History
Date
Name
Owned For
Owner Type
Purchase Details
Closed on
Feb 27, 2017
Sold by
Phillips Amanda and Phillips Gary
Bought by
Bex Michael L and Bex Lisa M
Current Estimated Value
Purchase Details
Closed on
Sep 9, 2016
Sold by
Estate Of Marcia K Perry
Bought by
Phillips Amanda
Purchase Details
Closed on
May 26, 2016
Sold by
Estate Of Marcia K Perry
Bought by
Phillips Amanda
Purchase Details
Closed on
May 4, 2012
Sold by
Perry Keith and Perry Marcia K
Bought by
Perry Bryan K and Perry Charlene
Purchase Details
Closed on
May 20, 1992
Sold by
Perry Keith and Perry Marcia K
Bought by
Perry Keith and Perry Marcia K
Purchase Details
Closed on
Jan 1, 1986
Sold by
Barrett Jeanne
Bought by
Barrett Jeanne
Create a Home Valuation Report for This Property
The Home Valuation Report is an in-depth analysis detailing your home's value as well as a comparison with similar homes in the area
Home Values in the Area
Average Home Value in this Area
Purchase History
| Date | Buyer | Sale Price | Title Company |
|---|---|---|---|
| Bex Michael L | $5,000 | Attorney | |
| Phillips Amanda | -- | Attorney | |
| Phillips Amanda | -- | None Available | |
| Perry Bryan K | -- | Attorney | |
| Perry Keith | $28,800 | -- | |
| Barrett Jeanne | -- | -- |
Source: Public Records
Tax History Compared to Growth
Tax History
| Year | Tax Paid | Tax Assessment Tax Assessment Total Assessment is a certain percentage of the fair market value that is determined by local assessors to be the total taxable value of land and additions on the property. | Land | Improvement |
|---|---|---|---|---|
| 2024 | $1,514 | $28,840 | $3,520 | $25,320 |
| 2023 | $1,577 | $21,210 | $3,550 | $17,660 |
| 2022 | $1,387 | $21,213 | $3,549 | $17,664 |
| 2021 | $1,916 | $21,213 | $3,549 | $17,664 |
| 2020 | $1,424 | $18,460 | $3,090 | $15,370 |
| 2019 | $1,841 | $18,460 | $3,090 | $15,370 |
| 2018 | $1,347 | $18,460 | $3,090 | $15,370 |
| 2017 | $846 | $16,060 | $2,270 | $13,790 |
| 2016 | $785 | $16,060 | $2,270 | $13,790 |
| 2015 | $1,025 | $16,060 | $2,270 | $13,790 |
| 2014 | $680 | $15,200 | $2,070 | $13,130 |
| 2013 | $643 | $15,220 | $2,090 | $13,130 |
Source: Public Records
Map
Nearby Homes