Estimated Value: $102,631 - $177,000
--
Bed
1
Bath
1,076
Sq Ft
$123/Sq Ft
Est. Value
About This Home
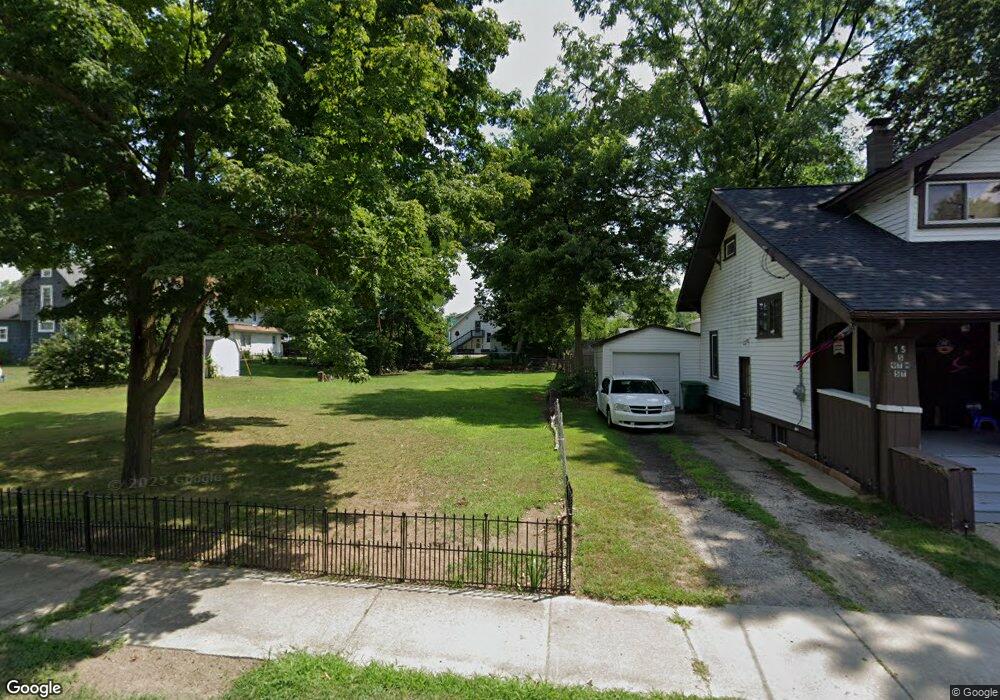
This home is located at 11 S 9th St, Niles, MI 49120 and is currently estimated at $132,658, approximately $123 per square foot. 11 S 9th St is a home located in Berrien County with nearby schools including Ballard Elementary School, Oak Manor Sixth Grade Center, and Ring Lardner Middle School.
Ownership History
Date
Name
Owned For
Owner Type
Purchase Details
Closed on
Jul 23, 2020
Sold by
Levi 11 Llc
Bought by
Thompson Julie
Current Estimated Value
Purchase Details
Closed on
Nov 1, 2019
Sold by
Berrien County Land Bank Authority
Bought by
Levi 11 Llc
Purchase Details
Closed on
Aug 24, 2018
Sold by
Berrien County Treasurer
Bought by
Berrien County Land Bank Authority
Purchase Details
Closed on
Sep 15, 2005
Sold by
Marshall Max Eugene and Marshall Charlene V
Bought by
Marshall Max Eugene and Harper Bertha Mae
Create a Home Valuation Report for This Property
The Home Valuation Report is an in-depth analysis detailing your home's value as well as a comparison with similar homes in the area
Home Values in the Area
Average Home Value in this Area
Purchase History
| Date | Buyer | Sale Price | Title Company |
|---|---|---|---|
| Thompson Julie | $1,500 | None Listed On Document | |
| Thompson Julie | $1,500 | None Available | |
| Levi 11 Llc | -- | None Available | |
| Berrien County Land Bank Authority | -- | None Available | |
| Marshall Max Eugene | -- | -- |
Source: Public Records
Tax History Compared to Growth
Tax History
| Year | Tax Paid | Tax Assessment Tax Assessment Total Assessment is a certain percentage of the fair market value that is determined by local assessors to be the total taxable value of land and additions on the property. | Land | Improvement |
|---|---|---|---|---|
| 2025 | $297 | $6,600 | $0 | $0 |
| 2024 | $139 | $5,000 | $0 | $0 |
| 2023 | $133 | $4,600 | $0 | $0 |
| 2022 | $127 | $4,600 | $0 | $0 |
| 2021 | $248 | $4,100 | $4,100 | $0 |
| 2020 | $137 | $2,100 | $0 | $0 |
| 2019 | $20 | $38,500 | $11,200 | $27,300 |
| 2018 | $1,012 | $38,500 | $0 | $0 |
| 2017 | $1,552 | $31,500 | $0 | $0 |
| 2016 | $1,672 | $29,300 | $0 | $0 |
| 2015 | $816 | $27,100 | $0 | $0 |
| 2014 | $632 | $26,900 | $0 | $0 |
Source: Public Records
Map
Nearby Homes