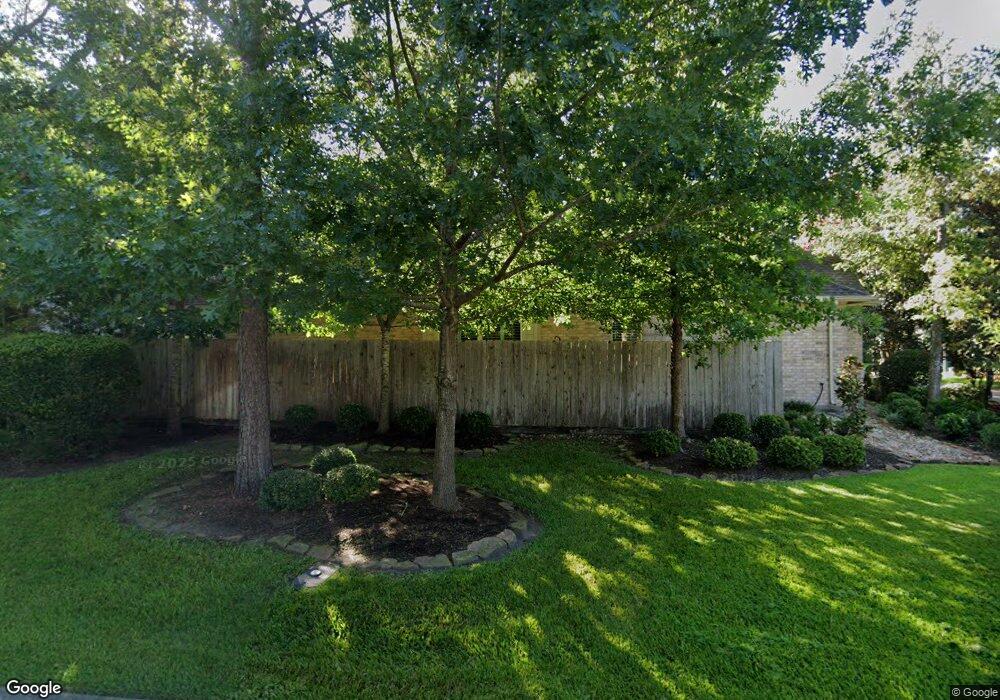
11 S Ashley Green Spring, TX 77382
Alden Bridge NeighborhoodEstimated Value: $401,000 - $434,000
--
Bed
2
Baths
2,127
Sq Ft
$198/Sq Ft
Est. Value
About This Home
This home is located at 11 S Ashley Green, Spring, TX 77382 and is currently estimated at $421,063, approximately $197 per square foot. 11 S Ashley Green is a home located in Montgomery County with nearby schools including Buckalew Elementary School, Mitchell Intermediate School, and McCullough Junior High School.
Ownership History
Date
Name
Owned For
Owner Type
Purchase Details
Closed on
Aug 4, 2005
Sold by
National Transfer Services Llc
Bought by
Haskins David W and Haskins Janet S
Current Estimated Value
Home Financials for this Owner
Home Financials are based on the most recent Mortgage that was taken out on this home.
Original Mortgage
$118,000
Interest Rate
5.78%
Mortgage Type
Fannie Mae Freddie Mac
Purchase Details
Closed on
Jul 20, 2005
Sold by
Juedes Paul D and Juedes Sandra M
Bought by
National Transfer Services Llc
Home Financials for this Owner
Home Financials are based on the most recent Mortgage that was taken out on this home.
Original Mortgage
$118,000
Interest Rate
5.78%
Mortgage Type
Fannie Mae Freddie Mac
Purchase Details
Closed on
Dec 15, 1999
Sold by
Dynex Residential Inc
Bought by
Juedes Paul D and Juedes Sandra M
Home Financials for this Owner
Home Financials are based on the most recent Mortgage that was taken out on this home.
Original Mortgage
$96,990
Interest Rate
7.69%
Create a Home Valuation Report for This Property
The Home Valuation Report is an in-depth analysis detailing your home's value as well as a comparison with similar homes in the area
Home Values in the Area
Average Home Value in this Area
Purchase History
| Date | Buyer | Sale Price | Title Company |
|---|---|---|---|
| Haskins David W | -- | Charter Title Company | |
| National Transfer Services Llc | -- | Charter Title Company | |
| Juedes Paul D | -- | Regency Title |
Source: Public Records
Mortgage History
| Date | Status | Borrower | Loan Amount |
|---|---|---|---|
| Closed | Haskins David W | $118,000 | |
| Previous Owner | Juedes Paul D | $96,990 |
Source: Public Records
Tax History Compared to Growth
Tax History
| Year | Tax Paid | Tax Assessment Tax Assessment Total Assessment is a certain percentage of the fair market value that is determined by local assessors to be the total taxable value of land and additions on the property. | Land | Improvement |
|---|---|---|---|---|
| 2025 | $2,021 | $401,901 | -- | -- |
| 2024 | $2,011 | $365,365 | -- | -- |
| 2023 | $2,011 | $332,150 | $60,000 | $326,290 |
| 2022 | $3,585 | $301,950 | $60,000 | $309,790 |
| 2021 | $6,254 | $274,500 | $34,580 | $239,920 |
| 2020 | $6,736 | $291,200 | $34,580 | $256,620 |
| 2019 | $6,590 | $276,100 | $34,580 | $245,420 |
| 2018 | $4,709 | $251,000 | $34,580 | $216,420 |
| 2017 | $6,478 | $268,130 | $34,580 | $233,550 |
| 2016 | $5,972 | $247,170 | $34,580 | $223,420 |
| 2015 | $3,761 | $224,700 | $34,580 | $200,420 |
| 2014 | $3,761 | $204,270 | $34,580 | $181,530 |
Source: Public Records
Map
Nearby Homes
- 230 S Walden Elms Cir
- 27 S Belfair Place
- 7 Coachman Ridge Place
- 39 E Honey Grove Place
- 22 E Sienna Place
- 35 N Walden Elms Cir
- 26 N Walden Elms Cir
- 19 Timberstar St
- 71 N Acacia Park Cir
- 78 N Walden Elms Cir
- 27 Auburn Path Dr
- 269 Flaxen Chestnut
- 18 Wintergreen Trail
- 2 Wintergreen Trail
- 242 Flaxen Chestnut
- 406 Thistle Thorn Dr
- 27 Medley Ln
- 225 Fox Trotter
- 10 Acacia Park Place
- 47 Crocus Petal St
- 15 S Ashley Green
- 7 Ashley Green
- 10 Ashley Green
- 3 Ashley Green
- 3 Ashley Green
- 6 Ashley Green
- 15 Tudor Glen Place
- 14 Ashley Green
- 19 Tudor Glen Place
- 2 Ashley Green
- 18 Ashley Green
- 23 S Ashley Green
- 23 Tudor Glen Place
- 54 N Belfair Place
- 2 Tudor Glen Place
- 22 Ashley Green
- 50 N Belfair Place
- 6 Tudor Glen Place
- 58 N Belfair Place
- 26 Ashley Green