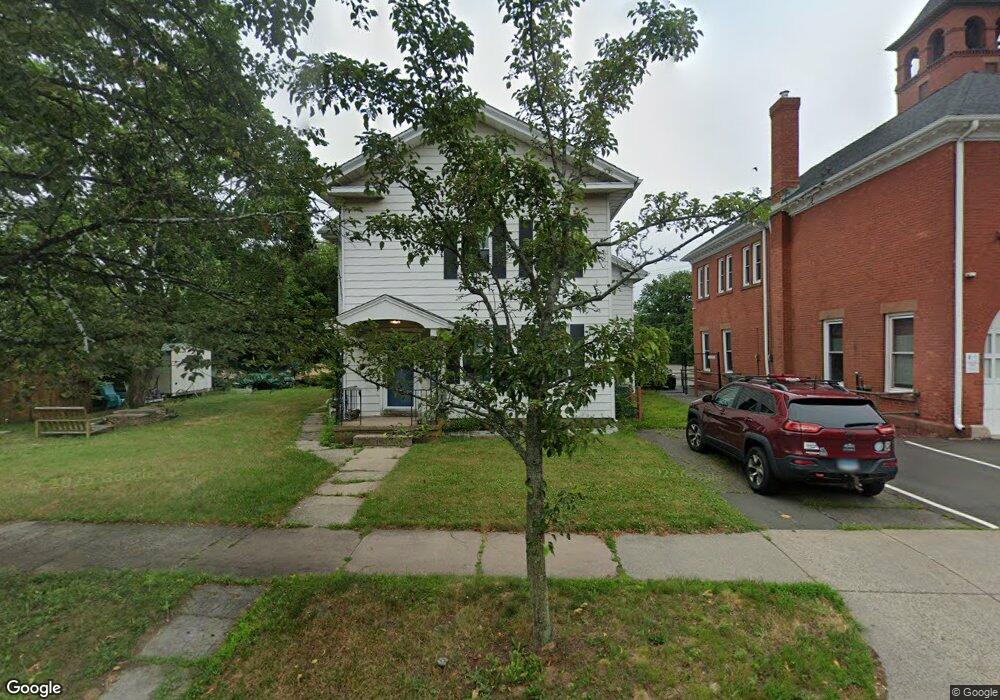
11 S Cherry St Wallingford, CT 06492
Estimated Value: $502,000 - $573,000
5
Beds
3
Baths
2,760
Sq Ft
$197/Sq Ft
Est. Value
About This Home
This home is located at 11 S Cherry St, Wallingford, CT 06492 and is currently estimated at $542,873, approximately $196 per square foot. 11 S Cherry St is a home located in New Haven County with nearby schools including Evarts C. Stevens School, Parker Farms School, and James H. Moran Middle School.
Ownership History
Date
Name
Owned For
Owner Type
Purchase Details
Closed on
Jun 28, 2006
Sold by
Pekala Christopher M and Angell Robert L
Bought by
Morawski Ronald J and Morawski Donna L
Current Estimated Value
Home Financials for this Owner
Home Financials are based on the most recent Mortgage that was taken out on this home.
Original Mortgage
$275,000
Interest Rate
6.58%
Purchase Details
Closed on
Sep 15, 2004
Sold by
Tnt Dev
Bought by
Pekala Christopher M and Angell Robert L
Purchase Details
Closed on
Sep 5, 2003
Sold by
Homecare Inc
Bought by
Tnt Developments
Purchase Details
Closed on
Jan 30, 1996
Sold by
Jerzyk Gilbert B
Bought by
Homecare Inc
Create a Home Valuation Report for This Property
The Home Valuation Report is an in-depth analysis detailing your home's value as well as a comparison with similar homes in the area
Home Values in the Area
Average Home Value in this Area
Purchase History
| Date | Buyer | Sale Price | Title Company |
|---|---|---|---|
| Morawski Ronald J | $365,000 | -- | |
| Morawski Ronald J | $365,000 | -- | |
| Pekala Christopher M | $314,900 | -- | |
| Pekala Christopher M | $314,900 | -- | |
| Tnt Developments | $140,000 | -- | |
| Tnt Developments | $140,000 | -- | |
| Homecare Inc | $180,000 | -- | |
| Homecare Inc | $180,000 | -- |
Source: Public Records
Mortgage History
| Date | Status | Borrower | Loan Amount |
|---|---|---|---|
| Open | Homecare Inc | $262,300 | |
| Closed | Homecare Inc | $275,000 |
Source: Public Records
Tax History
| Year | Tax Paid | Tax Assessment Tax Assessment Total Assessment is a certain percentage of the fair market value that is determined by local assessors to be the total taxable value of land and additions on the property. | Land | Improvement |
|---|---|---|---|---|
| 2025 | $7,429 | $308,000 | $75,900 | $232,100 |
| 2024 | $6,101 | $199,000 | $63,300 | $135,700 |
| 2023 | $5,839 | $199,000 | $63,300 | $135,700 |
| 2022 | $5,779 | $199,000 | $63,300 | $135,700 |
| 2021 | $5,675 | $199,000 | $63,300 | $135,700 |
| 2020 | $5,064 | $173,500 | $62,100 | $111,400 |
| 2019 | $5,064 | $173,500 | $62,100 | $111,400 |
| 2018 | $4,969 | $173,500 | $62,100 | $111,400 |
| 2017 | $4,953 | $173,500 | $62,100 | $111,400 |
| 2016 | $4,839 | $173,500 | $62,100 | $111,400 |
| 2015 | $4,766 | $173,500 | $62,100 | $111,400 |
| 2014 | $4,665 | $173,500 | $62,100 | $111,400 |
Source: Public Records
Map
Nearby Homes
- 42 S Cherry St Unit 238
- 120 S Cherry St
- 85 N Colony St
- 30 Clinton Place
- 90 Masonic Ave
- 31 S Turnpike Rd Unit C2
- 61 Cheshire Rd
- 570 N Main St
- 71 Cedar Ln
- 69 Terrace Gardens
- 70 N Turnpike Rd Unit 21
- 57 Terrace Gardens Unit 57
- 46 Walnut Ln
- 3 Spice Hill Dr
- 2 Brentwood Dr Unit 2
- 204 Parker Farms Rd
- 54 Parker Farms Rd
- 129 Brentwood Dr
- 30 King St
- 3 Loving Ln
- 9 S Cherry St
- 17 S Cherry St
- 156 Quinnipiac St
- 21 S Cherry St
- 166 Quinnipiac St
- 135 Quinnipiac St
- 27 S Cherry St
- 12 Judd Square
- 100 Quinnipiac St
- 33 S Cherry St
- 33 S Cherry St Unit 1
- 33 S Cherry St Unit 1ST
- 174 Quinnipiac St
- 171 Quinnipiac St
- 42 S Cherry St Unit 42 South Cherry St.
- 42 S Cherry St Unit 216
- 42 S Cherry St Unit 412
- 26 Judd Square Unit 26
- 209 Judd Square Unit 209
- 13 Judd Square
Your Personal Tour Guide
Ask me questions while you tour the home.