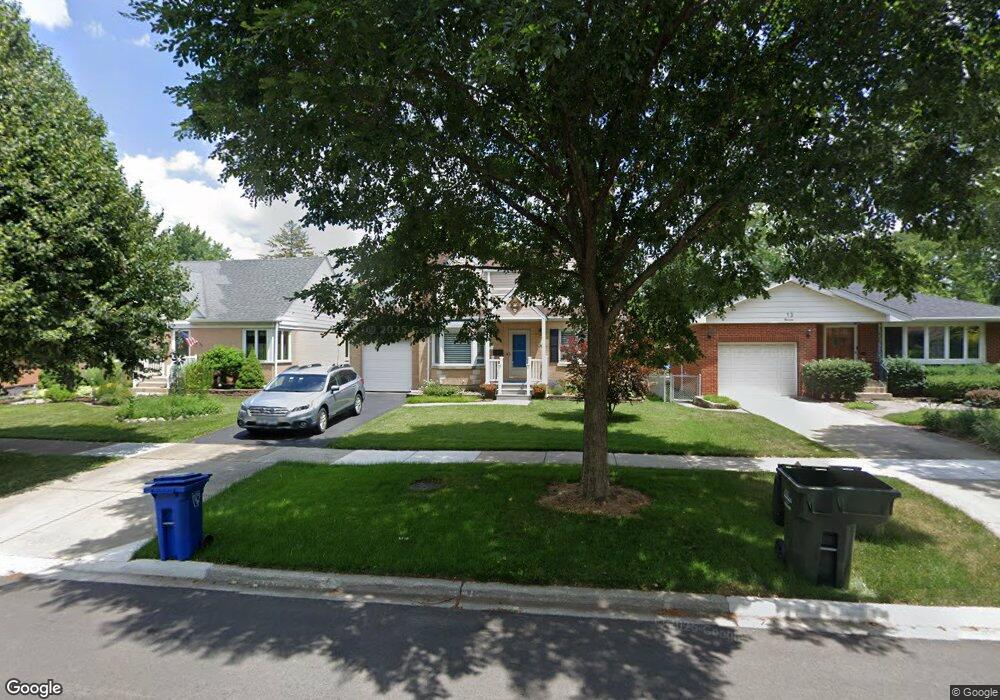
11 S Edward St Mount Prospect, IL 60056
Downtown Mount Prospect NeighborhoodEstimated Value: $558,000 - $582,000
4
Beds
3
Baths
1,810
Sq Ft
$314/Sq Ft
Est. Value
About This Home
This home is located at 11 S Edward St, Mount Prospect, IL 60056 and is currently estimated at $568,982, approximately $314 per square foot. 11 S Edward St is a home located in Cook County with nearby schools including Fairview Elementary School, Lincoln Middle School, and Prospect High School.
Ownership History
Date
Name
Owned For
Owner Type
Purchase Details
Closed on
Oct 7, 2025
Sold by
Ewing Laurence W and Stephenson Ann Marie
Bought by
Laurence W Ewing Jr Trust and Ann Marie Stephenson Trust
Current Estimated Value
Purchase Details
Closed on
Apr 16, 2004
Sold by
Nichols Edward A and Nichols June R
Bought by
Ewing Laurence W and Stephenson Ann Marie
Home Financials for this Owner
Home Financials are based on the most recent Mortgage that was taken out on this home.
Original Mortgage
$220,000
Interest Rate
5.46%
Mortgage Type
Unknown
Create a Home Valuation Report for This Property
The Home Valuation Report is an in-depth analysis detailing your home's value as well as a comparison with similar homes in the area
Home Values in the Area
Average Home Value in this Area
Purchase History
| Date | Buyer | Sale Price | Title Company |
|---|---|---|---|
| Laurence W Ewing Jr Trust | -- | None Listed On Document | |
| Ewing Laurence W | $360,000 | Atgf Inc |
Source: Public Records
Mortgage History
| Date | Status | Borrower | Loan Amount |
|---|---|---|---|
| Previous Owner | Ewing Laurence W | $220,000 |
Source: Public Records
Tax History
| Year | Tax Paid | Tax Assessment Tax Assessment Total Assessment is a certain percentage of the fair market value that is determined by local assessors to be the total taxable value of land and additions on the property. | Land | Improvement |
|---|---|---|---|---|
| 2025 | $10,219 | $49,000 | $9,200 | $39,800 |
| 2024 | $10,219 | $40,000 | $7,600 | $32,400 |
| 2023 | $9,798 | $40,000 | $7,600 | $32,400 |
| 2022 | $9,798 | $40,000 | $7,600 | $32,400 |
| 2021 | $10,951 | $38,475 | $4,800 | $33,675 |
| 2020 | $10,793 | $38,475 | $4,800 | $33,675 |
| 2019 | $10,916 | $43,231 | $4,800 | $38,431 |
| 2018 | $7,609 | $28,308 | $4,000 | $24,308 |
| 2017 | $7,648 | $28,308 | $4,000 | $24,308 |
| 2016 | $7,184 | $29,539 | $4,000 | $25,539 |
| 2015 | $8,332 | $31,291 | $3,600 | $27,691 |
| 2014 | $8,207 | $31,291 | $3,600 | $27,691 |
| 2013 | $8,182 | $31,291 | $3,600 | $27,691 |
Source: Public Records
Map
Nearby Homes
- 908 E Central Rd
- 1100 N Boxwood Dr Unit P4P5P6
- 305 S George St
- 576 Amherst Ave
- 114 S Elm St
- 17 S Maple St
- 1102 E Ardyce Ln
- 408 S Albert St
- 475 Amherst Ave
- 502 S Edward St
- 130 N Horner Ln
- 10 S Wille St Unit 603
- 10 S Wille St Unit 201
- 215 N Main St
- 5 S Pine St Unit 506B
- 406 N Elm St
- 519 N Elm St
- 210 N Russel St
- 586 N 7th Ave Unit 4
- 608 N Eastman Dr
Your Personal Tour Guide
Ask me questions while you tour the home.