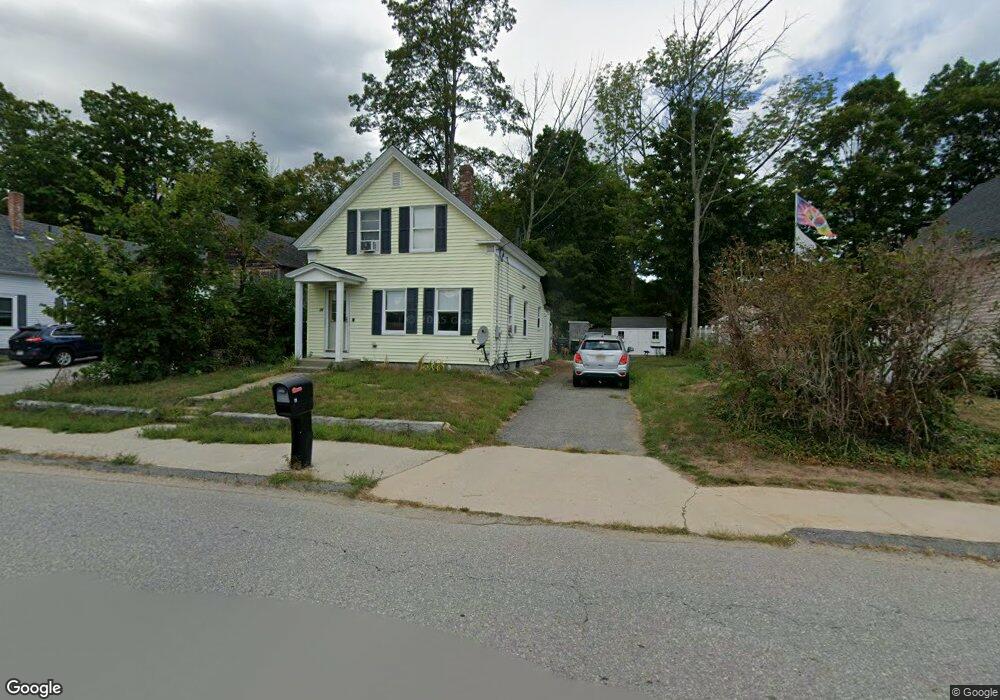
11 S Main St Ashburnham, MA 01430
Estimated Value: $260,944 - $323,000
3
Beds
1
Bath
878
Sq Ft
$336/Sq Ft
Est. Value
About This Home
This home is located at 11 S Main St, Ashburnham, MA 01430 and is currently estimated at $295,236, approximately $336 per square foot. 11 S Main St is a home located in Worcester County with nearby schools including Oakmont Regional High School, Holy Family Academy, and Wachusett Hills Christian School.
Ownership History
Date
Name
Owned For
Owner Type
Purchase Details
Closed on
Nov 8, 2002
Sold by
Christie Kelly M
Bought by
Vicconti Michael and Viconti Christine
Current Estimated Value
Home Financials for this Owner
Home Financials are based on the most recent Mortgage that was taken out on this home.
Original Mortgage
$144,300
Outstanding Balance
$60,530
Interest Rate
6.04%
Mortgage Type
Purchase Money Mortgage
Estimated Equity
$234,706
Purchase Details
Closed on
Apr 21, 1998
Sold by
Fisher Wayne E
Bought by
Crestar Mtg Corp
Create a Home Valuation Report for This Property
The Home Valuation Report is an in-depth analysis detailing your home's value as well as a comparison with similar homes in the area
Home Values in the Area
Average Home Value in this Area
Purchase History
| Date | Buyer | Sale Price | Title Company |
|---|---|---|---|
| Vicconti Michael | $146,600 | -- | |
| Vicconti Michael | $146,600 | -- | |
| Crestar Mtg Corp | $52,500 | -- | |
| Crestar Mtg Corp | $52,500 | -- |
Source: Public Records
Mortgage History
| Date | Status | Borrower | Loan Amount |
|---|---|---|---|
| Open | Crestar Mtg Corp | $144,300 | |
| Closed | Crestar Mtg Corp | $144,300 | |
| Previous Owner | Crestar Mtg Corp | $102,400 | |
| Previous Owner | Crestar Mtg Corp | $35,000 |
Source: Public Records
Tax History Compared to Growth
Tax History
| Year | Tax Paid | Tax Assessment Tax Assessment Total Assessment is a certain percentage of the fair market value that is determined by local assessors to be the total taxable value of land and additions on the property. | Land | Improvement |
|---|---|---|---|---|
| 2025 | $3,029 | $203,700 | $29,800 | $173,900 |
| 2024 | $2,974 | $188,800 | $29,800 | $159,000 |
| 2023 | $3,040 | $183,700 | $29,800 | $153,900 |
| 2022 | $3,000 | $158,900 | $28,600 | $130,300 |
| 2021 | $2,988 | $145,400 | $28,600 | $116,800 |
| 2020 | $2,923 | $145,400 | $28,600 | $116,800 |
| 2019 | $2,722 | $120,700 | $28,600 | $92,100 |
| 2018 | $3,502 | $113,500 | $27,200 | $86,300 |
| 2017 | $2,772 | $120,700 | $35,100 | $85,600 |
| 2016 | $2,728 | $119,900 | $34,500 | $85,400 |
| 2015 | $2,671 | $119,900 | $34,500 | $85,400 |
Source: Public Records
Map
Nearby Homes
- 66 S Main St
- 84 Murray Rd
- 179 Cashman Hill Rd
- 15 Kirali Ct
- 18 Corey Hill Rd
- 48 Willard Rd
- 9 Willard Rd
- 136 Willard Rd
- Lot 40C Winchendon Rd
- 280 Stone St
- 105 Ridgewood Ln Unit 22
- 53 Ridgewood Ln Unit 16
- 40 Hunter Ave
- 30 Foster Ct
- 0 Pearl St Unit 73213938
- 68 Olde Colonial Dr Unit 6
- 212 Pearl St
- 87 Crestwood Dr
- 213 Woodland Ave
- 21 Crestwood Dr