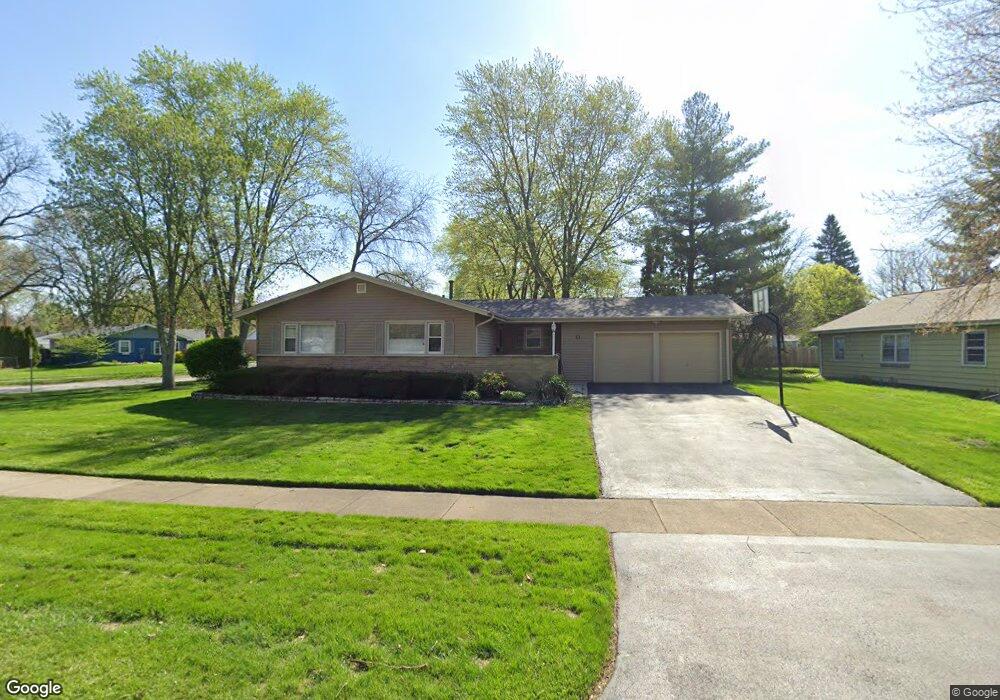
11 S Sycamore Ln North Aurora, IL 60542
Estimated Value: $313,000 - $332,000
3
Beds
1
Bath
1,311
Sq Ft
$249/Sq Ft
Est. Value
About This Home
This home is located at 11 S Sycamore Ln, North Aurora, IL 60542 and is currently estimated at $326,834, approximately $249 per square foot. 11 S Sycamore Ln is a home located in Kane County with nearby schools including Goodwin Elementary School, Jewel Middle School, and West Aurora High School.
Ownership History
Date
Name
Owned For
Owner Type
Purchase Details
Closed on
Jul 10, 2019
Sold by
Auchstetter Gerald and Auchstetter Linda
Bought by
Renner Kelsey
Current Estimated Value
Home Financials for this Owner
Home Financials are based on the most recent Mortgage that was taken out on this home.
Original Mortgage
$171,448
Outstanding Balance
$149,579
Interest Rate
3.62%
Mortgage Type
FHA
Estimated Equity
$177,255
Purchase Details
Closed on
Jun 30, 2008
Sold by
Renner Dennis Patrick and Renner Amy Marie
Bought by
Auchstetter Gerald and Auchstetter Linda
Purchase Details
Closed on
Aug 12, 1994
Sold by
Burnette Byron Kelly and Burnette Brenda G
Bought by
Renner Dennis Patrick and Renner Amy Marie
Home Financials for this Owner
Home Financials are based on the most recent Mortgage that was taken out on this home.
Original Mortgage
$120,000
Interest Rate
8%
Mortgage Type
Purchase Money Mortgage
Create a Home Valuation Report for This Property
The Home Valuation Report is an in-depth analysis detailing your home's value as well as a comparison with similar homes in the area
Home Values in the Area
Average Home Value in this Area
Purchase History
We collect this data history from publicly available records. To have your information removed, we recommend requesting removal directly through your county’s website.
| Date | Buyer | Sale Price | Title Company |
|---|---|---|---|
| Renner Kelsey | $193,500 | First American Title | |
| Auchstetter Gerald | $210,000 | First American Title | |
| Renner Dennis Patrick | $84,666 | Chicago Itle Insurance Co |
Source: Public Records
Mortgage History
We collect this data history from publicly available records. To have your information removed, we recommend requesting removal directly through your county’s website.
| Date | Status | Borrower | Loan Amount |
|---|---|---|---|
| Open | Renner Kelsey | $171,448 | |
| Previous Owner | Renner Dennis Patrick | $120,000 |
Source: Public Records
Tax History
| Year | Tax Paid | Tax Assessment Tax Assessment Total Assessment is a certain percentage of the fair market value that is determined by local assessors to be the total taxable value of land and additions on the property. | Land | Improvement |
|---|---|---|---|---|
| 2024 | $6,417 | $92,311 | $13,622 | $78,689 |
| 2023 | $6,139 | $82,479 | $12,171 | $70,308 |
| 2022 | $5,803 | $75,255 | $11,105 | $64,150 |
| 2021 | $5,532 | $70,063 | $10,339 | $59,724 |
| 2020 | $5,789 | $71,794 | $9,603 | $62,191 |
| 2019 | $6,154 | $66,519 | $8,897 | $57,622 |
| 2018 | $5,872 | $61,353 | $8,230 | $53,123 |
| 2017 | $5,495 | $55,803 | $7,583 | $48,220 |
| 2016 | $5,009 | $49,335 | $6,327 | $43,008 |
| 2015 | -- | $43,316 | $5,441 | $37,875 |
| 2014 | -- | $40,521 | $5,233 | $35,288 |
| 2013 | -- | $41,066 | $5,158 | $35,908 |
Source: Public Records
Map
Nearby Homes
- 422 Princeton Dr
- 4 S Cypress Ln
- 28 S Willow Way
- 357 Pheasant Hill Dr
- 415 Mallard Point Dr
- 208 W State St
- 406 Juniper Dr
- 423 Prairie Ridge Ln
- 415 Juniper Dr
- 409 E Victoria Cir Unit 409
- 444 Prairie Ridge Ln
- 448 Prairie Ridge Ln
- 523 Mallard Point Dr Unit 1
- 459 Prairie Ridge Ln
- 451 Pheasant Hill Dr
- 233 Spring Ct
- 403-405 S Lincolnway St
- 1438 Westbury Cir
- 1368 Hearthstone Ln
- 116 Briar Ln Unit 2
- 13 S Sycamore Ln
- 504 Harmony Dr
- 15 S Sycamore Ln
- 12 S Sycamore Ln
- 5 S Sycamore Ln
- 509 Harmony Dr
- 507 Harmony Dr
- 502 Harmony Dr
- 14 S Sycamore Ln
- 17 S Sycamore Ln
- 14 Hawthorne Dr
- 505 Harmony Dr
- 604 Harmony Dr
- 16 S Sycamore Ln
- 3 S Sycamore Ln
- 501 Harmony Dr
- 18 S Sycamore Ln
- 19 S Sycamore Ln
- 16 Hawthorne Dr
- 510 W State St
Your Personal Tour Guide
Ask me questions while you tour the home.