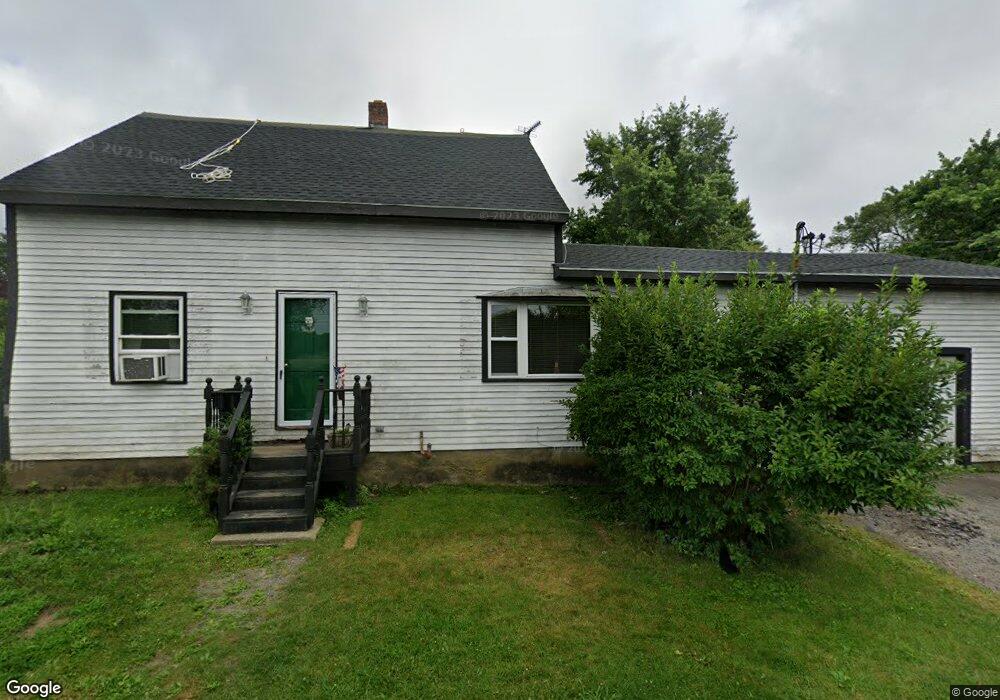
11 Sachem St Warren, RI 02885
Child Street West NeighborhoodEstimated Value: $481,000 - $513,000
3
Beds
2
Baths
1,482
Sq Ft
$334/Sq Ft
Est. Value
About This Home
This home is located at 11 Sachem St, Warren, RI 02885 and is currently estimated at $494,724, approximately $333 per square foot. 11 Sachem St is a home located in Bristol County with nearby schools including Mt. Hope High School, Highlander Charter Middle and High School, and East Bay Career Academy.
Ownership History
Date
Name
Owned For
Owner Type
Purchase Details
Closed on
Sep 30, 2014
Sold by
Verrette Lisa M
Bought by
Verrette Lisa M and Verrette Robert P
Current Estimated Value
Home Financials for this Owner
Home Financials are based on the most recent Mortgage that was taken out on this home.
Original Mortgage
$110,000
Outstanding Balance
$84,020
Interest Rate
4%
Mortgage Type
Adjustable Rate Mortgage/ARM
Estimated Equity
$410,705
Purchase Details
Closed on
Jun 8, 1995
Sold by
Verrette Robert P and Verrette Carol
Bought by
Verrette Lisa M
Home Financials for this Owner
Home Financials are based on the most recent Mortgage that was taken out on this home.
Original Mortgage
$64,000
Interest Rate
8.21%
Purchase Details
Closed on
Jan 26, 1989
Sold by
Verrette Robert
Bought by
Randall William
Create a Home Valuation Report for This Property
The Home Valuation Report is an in-depth analysis detailing your home's value as well as a comparison with similar homes in the area
Home Values in the Area
Average Home Value in this Area
Purchase History
| Date | Buyer | Sale Price | Title Company |
|---|---|---|---|
| Verrette Lisa M | -- | -- | |
| Verrette Lisa M | $50,000 | -- | |
| Randall William | $30,000 | -- |
Source: Public Records
Mortgage History
| Date | Status | Borrower | Loan Amount |
|---|---|---|---|
| Open | Randall William | $110,000 | |
| Previous Owner | Randall William | $98,000 | |
| Previous Owner | Randall William | $60,000 | |
| Previous Owner | Randall William | $64,000 |
Source: Public Records
Tax History Compared to Growth
Tax History
| Year | Tax Paid | Tax Assessment Tax Assessment Total Assessment is a certain percentage of the fair market value that is determined by local assessors to be the total taxable value of land and additions on the property. | Land | Improvement |
|---|---|---|---|---|
| 2025 | $5,341 | $358,700 | $164,400 | $194,300 |
| 2024 | $5,180 | $358,700 | $164,400 | $194,300 |
| 2023 | $4,900 | $358,700 | $164,400 | $194,300 |
| 2022 | $4,915 | $272,900 | $142,400 | $130,500 |
| 2021 | $4,836 | $272,900 | $142,400 | $130,500 |
| 2020 | $4,738 | $272,900 | $142,400 | $130,500 |
| 2019 | $4,483 | $234,600 | $114,400 | $120,200 |
| 2018 | $4,425 | $234,600 | $114,400 | $120,200 |
| 2017 | $4,413 | $234,600 | $114,400 | $120,200 |
| 2016 | $4,056 | $203,100 | $94,500 | $108,600 |
| 2015 | $4,056 | $203,100 | $94,500 | $108,600 |
| 2014 | $4,076 | $203,100 | $94,500 | $108,600 |
Source: Public Records
Map
Nearby Homes
- 4 Read Ave
- 397 Child St
- 0 Overhill Rd Unit 1382248
- 85 Canario Dr
- 41 N Cornell Ave
- 39 N Cornell Ave
- 69 Cutler St
- 51 Cutler St
- 25 Asylum Rd
- 510 Child St Unit 303A
- 510 Child St Unit 105B
- 510 Child St Unit 201C
- 510 Child St Unit 402B
- 510 Child St Unit 305B
- 210 Metacom Ave
- 7 Broadview Ave
- 115 Market St
- 17 Colonial Dr
- 21 Federal St
- 39 Broad St