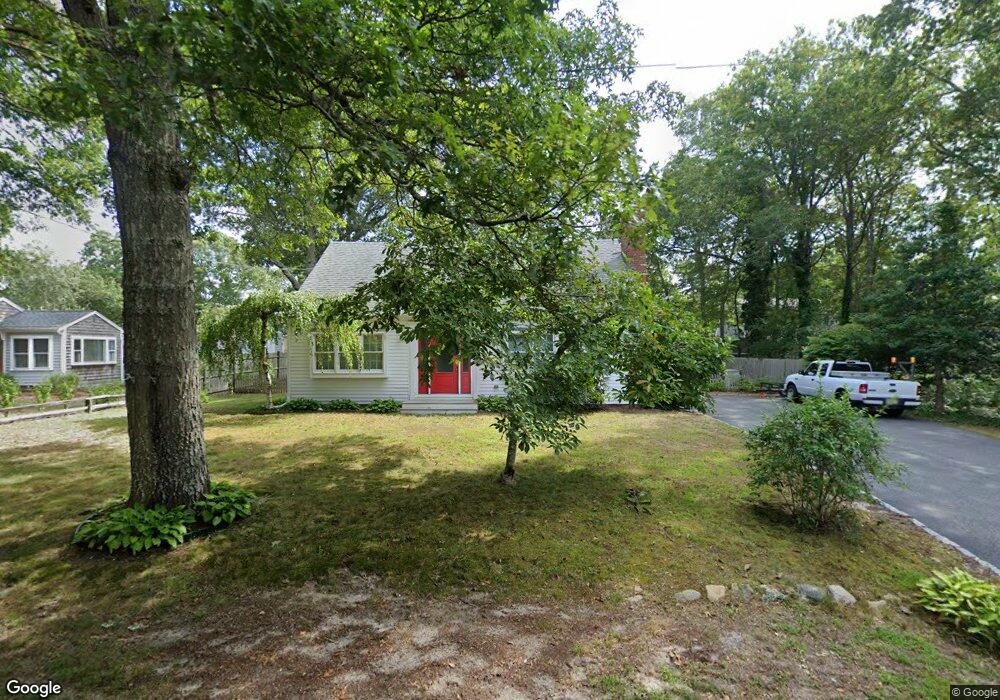
11 Saga Rd South Dennis, MA 02660
South Dennis NeighborhoodEstimated Value: $676,000 - $799,000
4
Beds
2
Baths
1,501
Sq Ft
$480/Sq Ft
Est. Value
About This Home
This home is located at 11 Saga Rd, South Dennis, MA 02660 and is currently estimated at $720,052, approximately $479 per square foot. 11 Saga Rd is a home located in Barnstable County with nearby schools including Dennis-Yarmouth Regional High School and St. Pius X. School.
Ownership History
Date
Name
Owned For
Owner Type
Purchase Details
Closed on
Sep 17, 2004
Sold by
Spencer Morton R and Spencer Sheila E
Bought by
Colella Katherine P and Colella Robert A
Current Estimated Value
Home Financials for this Owner
Home Financials are based on the most recent Mortgage that was taken out on this home.
Original Mortgage
$28,000
Outstanding Balance
$14,001
Interest Rate
6.02%
Mortgage Type
Purchase Money Mortgage
Estimated Equity
$706,051
Purchase Details
Closed on
Dec 18, 1998
Sold by
Costa Carolyn C
Bought by
Spencer Morton R and Spencer Sheila A
Home Financials for this Owner
Home Financials are based on the most recent Mortgage that was taken out on this home.
Original Mortgage
$80,000
Interest Rate
6.85%
Mortgage Type
Purchase Money Mortgage
Create a Home Valuation Report for This Property
The Home Valuation Report is an in-depth analysis detailing your home's value as well as a comparison with similar homes in the area
Home Values in the Area
Average Home Value in this Area
Purchase History
| Date | Buyer | Sale Price | Title Company |
|---|---|---|---|
| Colella Katherine P | $340,000 | -- | |
| Spencer Morton R | $132,900 | -- |
Source: Public Records
Mortgage History
| Date | Status | Borrower | Loan Amount |
|---|---|---|---|
| Open | Colella Katherine P | $28,000 | |
| Previous Owner | Spencer Morton R | $80,000 |
Source: Public Records
Tax History Compared to Growth
Tax History
| Year | Tax Paid | Tax Assessment Tax Assessment Total Assessment is a certain percentage of the fair market value that is determined by local assessors to be the total taxable value of land and additions on the property. | Land | Improvement |
|---|---|---|---|---|
| 2025 | $2,735 | $631,600 | $134,500 | $497,100 |
| 2024 | $2,657 | $605,200 | $129,300 | $475,900 |
| 2023 | $2,569 | $550,200 | $117,500 | $432,700 |
| 2022 | $2,453 | $438,100 | $117,700 | $320,400 |
| 2021 | $2,411 | $369,200 | $115,300 | $253,900 |
| 2020 | $1,024 | $354,600 | $115,300 | $239,300 |
| 2019 | $2,059 | $333,700 | $124,400 | $209,300 |
| 2018 | $1,951 | $307,800 | $107,700 | $200,100 |
| 2017 | $1,893 | $307,800 | $107,700 | $200,100 |
| 2016 | $1,856 | $284,200 | $113,000 | $171,200 |
| 2015 | $1,800 | $281,300 | $113,000 | $168,300 |
| 2014 | $1,650 | $259,900 | $96,900 | $163,000 |
Source: Public Records
Map
Nearby Homes