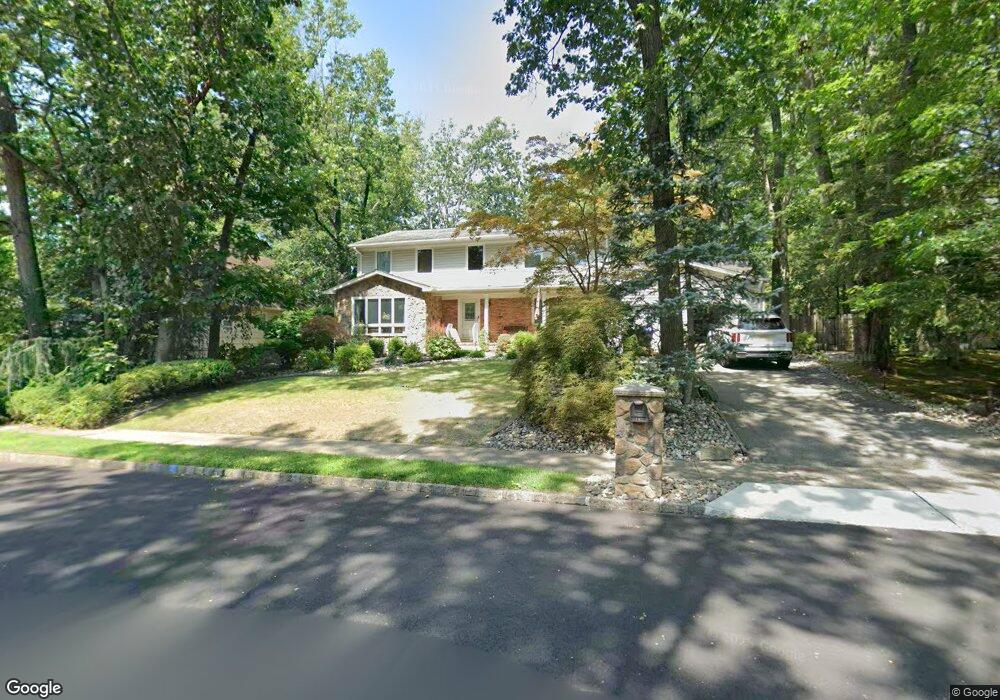
11 Sagamore Ln East Brunswick, NJ 08816
Estimated Value: $796,781 - $1,107,000
--
Bed
--
Bath
3,003
Sq Ft
$326/Sq Ft
Est. Value
About This Home
This home is located at 11 Sagamore Ln, East Brunswick, NJ 08816 and is currently estimated at $979,445, approximately $326 per square foot. 11 Sagamore Ln is a home located in Middlesex County with nearby schools including Central Elementary School, Hammarskjold Upper Elementary School, and Churchill Junior High School.
Ownership History
Date
Name
Owned For
Owner Type
Purchase Details
Closed on
Jun 1, 2011
Sold by
Lo Honghsi Albert and Lo Yanling
Bought by
Ockun Jason C and Ockun Felice R
Current Estimated Value
Home Financials for this Owner
Home Financials are based on the most recent Mortgage that was taken out on this home.
Original Mortgage
$250,000
Outstanding Balance
$174,114
Interest Rate
4.85%
Mortgage Type
New Conventional
Estimated Equity
$805,331
Purchase Details
Closed on
Nov 30, 1999
Sold by
Burman Lester
Bought by
Lo Honghsi Albert and Lo Yanling
Home Financials for this Owner
Home Financials are based on the most recent Mortgage that was taken out on this home.
Original Mortgage
$280,000
Interest Rate
7.61%
Create a Home Valuation Report for This Property
The Home Valuation Report is an in-depth analysis detailing your home's value as well as a comparison with similar homes in the area
Home Values in the Area
Average Home Value in this Area
Purchase History
| Date | Buyer | Sale Price | Title Company |
|---|---|---|---|
| Ockun Jason C | $550,000 | First American Title Ins Co | |
| Lo Honghsi Albert | $353,000 | -- |
Source: Public Records
Mortgage History
| Date | Status | Borrower | Loan Amount |
|---|---|---|---|
| Open | Ockun Jason C | $250,000 | |
| Previous Owner | Lo Honghsi Albert | $280,000 |
Source: Public Records
Tax History Compared to Growth
Tax History
| Year | Tax Paid | Tax Assessment Tax Assessment Total Assessment is a certain percentage of the fair market value that is determined by local assessors to be the total taxable value of land and additions on the property. | Land | Improvement |
|---|---|---|---|---|
| 2025 | $16,003 | $133,300 | $40,600 | $92,700 |
| 2024 | $15,565 | $133,300 | $40,600 | $92,700 |
| 2023 | $15,565 | $133,300 | $40,600 | $92,700 |
| 2022 | $15,509 | $133,300 | $40,600 | $92,700 |
| 2021 | $15,062 | $133,300 | $40,600 | $92,700 |
| 2020 | $15,046 | $133,300 | $40,600 | $92,700 |
| 2019 | $14,890 | $133,300 | $40,600 | $92,700 |
| 2018 | $14,622 | $133,300 | $40,600 | $92,700 |
| 2017 | $14,384 | $133,300 | $40,600 | $92,700 |
| 2016 | $14,086 | $133,300 | $40,600 | $92,700 |
| 2015 | $13,733 | $133,300 | $40,600 | $92,700 |
| 2014 | $13,439 | $133,300 | $40,600 | $92,700 |
Source: Public Records
Map
Nearby Homes