11 Saint Andrews Ln Bella Vista, AR 72715
Estimated Value: $494,000 - $532,432
--
Bed
3
Baths
2,398
Sq Ft
$217/Sq Ft
Est. Value
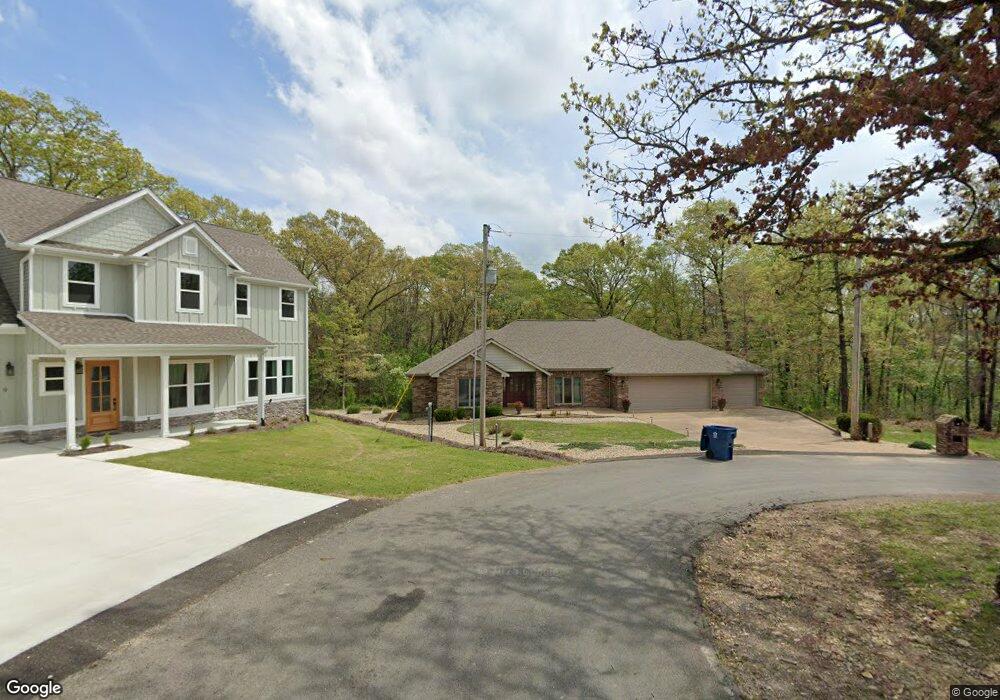
About This Home
This home is located at 11 Saint Andrews Ln, Bella Vista, AR 72715 and is currently estimated at $519,858, approximately $216 per square foot. 11 Saint Andrews Ln is a home located in Benton County with nearby schools including Glenn Duffy Elementary School, Gravette Upper Elementary School, and Gravette Middle School.
Ownership History
Date
Name
Owned For
Owner Type
Purchase Details
Closed on
Jan 20, 2006
Sold by
Mosby Larry O
Bought by
Pike Lawrence R and Pike Susan L
Current Estimated Value
Home Financials for this Owner
Home Financials are based on the most recent Mortgage that was taken out on this home.
Original Mortgage
$180,800
Outstanding Balance
$101,443
Interest Rate
6.24%
Mortgage Type
New Conventional
Estimated Equity
$418,415
Purchase Details
Closed on
Aug 11, 2004
Bought by
Mosby Tr
Purchase Details
Closed on
Aug 5, 2004
Bought by
Mosby Tr
Purchase Details
Closed on
Jun 4, 2004
Bought by
Dod Dod 5 and Dod 15
Purchase Details
Closed on
Sep 17, 1996
Bought by
Mosby
Purchase Details
Closed on
Jan 13, 1994
Bought by
Stingle
Purchase Details
Closed on
Jan 29, 1990
Bought by
Linskens
Create a Home Valuation Report for This Property
The Home Valuation Report is an in-depth analysis detailing your home's value as well as a comparison with similar homes in the area
Home Values in the Area
Average Home Value in this Area
Purchase History
| Date | Buyer | Sale Price | Title Company |
|---|---|---|---|
| Pike Lawrence R | $325,000 | None Available | |
| Mosby Tr | -- | -- | |
| Trust | -- | -- | |
| Mosby Tr | -- | -- | |
| Trust | -- | -- | |
| Dod Dod 5 | -- | -- | |
| Mosby | $6,000 | -- | |
| Stingle | $9,000 | -- | |
| Linskens | $15,000 | -- |
Source: Public Records
Mortgage History
| Date | Status | Borrower | Loan Amount |
|---|---|---|---|
| Open | Pike Lawrence R | $180,800 |
Source: Public Records
Tax History Compared to Growth
Tax History
| Year | Tax Paid | Tax Assessment Tax Assessment Total Assessment is a certain percentage of the fair market value that is determined by local assessors to be the total taxable value of land and additions on the property. | Land | Improvement |
|---|---|---|---|---|
| 2025 | $2,068 | $90,192 | $1,600 | $88,592 |
| 2024 | $1,986 | $90,192 | $1,600 | $88,592 |
| 2023 | $1,986 | $56,470 | $800 | $55,670 |
| 2022 | $1,729 | $56,470 | $800 | $55,670 |
| 2021 | $1,724 | $56,470 | $800 | $55,670 |
| 2020 | $1,732 | $40,560 | $600 | $39,960 |
| 2019 | $1,732 | $40,560 | $600 | $39,960 |
| 2018 | $1,757 | $40,560 | $600 | $39,960 |
| 2017 | $1,636 | $40,560 | $600 | $39,960 |
| 2016 | $1,636 | $40,560 | $600 | $39,960 |
| 2015 | $1,946 | $40,290 | $1,000 | $39,290 |
| 2014 | $1,596 | $40,290 | $1,000 | $39,290 |
Source: Public Records
Map
Nearby Homes
- 8 Killin Ln
- 6 Bonhill Ln
- 7 Saint Andrews Cir
- 2 Leawood Place
- 20 Leawood Ln
- 6 Leawood Place
- 4 Berfoyle Ln
- 4 Dirleton Dr
- 276 Kinross Dr
- 5 Brims Ness Ln
- 0 Boreray Ln Unit 1320018
- 5 Dunbarton Place
- 7 Boreray Ln
- 8 Kildonan Dr
- 106 Kinross Dr
- Lot 1, Block 2 Kinross Dr
- Lot 31 Alva Ln
- 32 Magrath Cir
- 40 Dirleton Dr
- 3 Dirleton Ln
- 9 Saint Andrews Ln
- 6 Saint Andrews Ln
- 5 Saint Andrews Ln
- 5 St Andrews Ln
- 0.28 AC Newstead Cir
- 0 St Andrews Ln Unit 538558
- 0 St Andrews Ln Unit 557016
- 0 St Andrews Ln Unit 1094995
- 0 St Andrews Ln Unit 1075862
- 0 St Andrews Ln Unit 1119884
- 0 Newstead Cir
- 2 Saint Andrews Ln
- 2 St Andrews Ln
- 2 Saint Andrews Ln
- 3 Saint Andrews Ln
- 5 Killin Ln
- 25 Saint Andrews Dr
- 27 St Andrews Dr
- 47 Saint Andrews Dr
- 49 Saint Andrews Dr