11 Saint Austell Dr Bella Vista, AR 72714
Estimated Value: $305,224 - $343,000
--
Bed
2
Baths
1,472
Sq Ft
$215/Sq Ft
Est. Value
About This Home
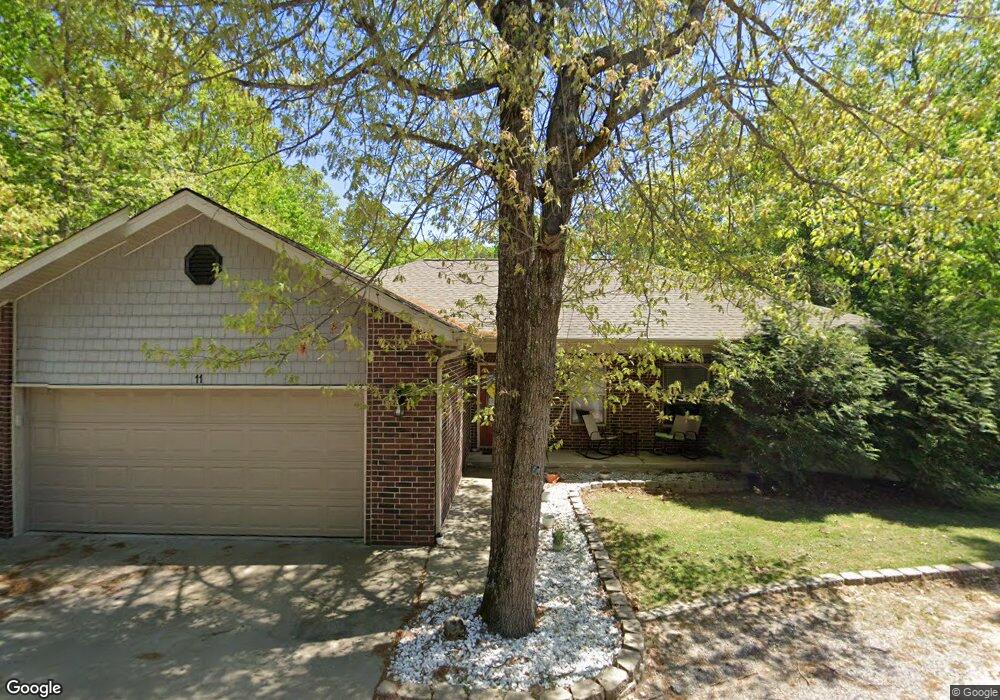
This home is located at 11 Saint Austell Dr, Bella Vista, AR 72714 and is currently estimated at $316,806, approximately $215 per square foot. 11 Saint Austell Dr is a home located in Benton County with nearby schools including Cooper Elementary School, Old High Middle School, and Washington Junior High School.
Ownership History
Date
Name
Owned For
Owner Type
Purchase Details
Closed on
Feb 17, 2017
Sold by
Tyler Thomas P
Bought by
Yeager William Daniel and Yeager Kell J
Current Estimated Value
Purchase Details
Closed on
May 19, 2006
Sold by
Edwards Robert E and Edwards Janet J
Bought by
Tyler Thomas P
Home Financials for this Owner
Home Financials are based on the most recent Mortgage that was taken out on this home.
Original Mortgage
$132,812
Interest Rate
6.5%
Mortgage Type
FHA
Purchase Details
Closed on
Jan 28, 2005
Sold by
Shubert David
Bought by
Edwards Robert E and Edwards Janet J
Purchase Details
Closed on
May 2, 1990
Sold by
Earley George P and Earley Edna M
Bought by
Shubert David W and Shubert Kathryn J
Create a Home Valuation Report for This Property
The Home Valuation Report is an in-depth analysis detailing your home's value as well as a comparison with similar homes in the area
Home Values in the Area
Average Home Value in this Area
Purchase History
| Date | Buyer | Sale Price | Title Company |
|---|---|---|---|
| Yeager William Daniel | $136,000 | Pci Advance Title | |
| Tyler Thomas P | $134,000 | Three Rivers Title Svcs Inc | |
| Edwards Robert E | $2,000 | None Available | |
| Shubert David W | $1,666 | None Available |
Source: Public Records
Mortgage History
| Date | Status | Borrower | Loan Amount |
|---|---|---|---|
| Previous Owner | Tyler Thomas P | $132,812 |
Source: Public Records
Tax History Compared to Growth
Tax History
| Year | Tax Paid | Tax Assessment Tax Assessment Total Assessment is a certain percentage of the fair market value that is determined by local assessors to be the total taxable value of land and additions on the property. | Land | Improvement |
|---|---|---|---|---|
| 2025 | $2,617 | $54,888 | $1,600 | $53,288 |
| 2024 | $2,375 | $54,888 | $1,600 | $53,288 |
| 2023 | $2,159 | $35,710 | $800 | $34,910 |
| 2022 | $2,057 | $35,710 | $800 | $34,910 |
| 2021 | $1,881 | $35,710 | $800 | $34,910 |
| 2020 | $1,726 | $27,090 | $600 | $26,490 |
| 2019 | $1,726 | $27,090 | $600 | $26,490 |
| 2018 | $1,726 | $27,090 | $600 | $26,490 |
| 2017 | $1,376 | $27,090 | $600 | $26,490 |
| 2016 | $1,290 | $27,090 | $600 | $26,490 |
| 2015 | $1,537 | $25,490 | $1,000 | $24,490 |
| 2014 | $1,187 | $25,490 | $1,000 | $24,490 |
Source: Public Records
Map
Nearby Homes
- 2 Stewkley Ln
- LOT 6 Wolverton Ln
- 0 Wolverton Ln
- 32 Saint Austell Dr
- 0 Ashby Ln
- Lot 15 Heanor Ln
- LOT 30 Saint Ives Cir
- Lots 3 & 4 Elton Ln
- Lot 40 of Block 1 Leicester Dr
- Lot 19 of Block 1 Leicester Dr
- 5 Inskid Ln
- TBD Ouse Ln
- 5 Pershore Ln
- 9 Cockerham Ln
- 0 Bosworth Cir
- Lot 9 of Block 8 Bosworth Cir
- Lot 6 Bosworth Cir
- Lot 9, Block 9 Bosworth Cir
- 1 Ramsey Dr
- 3 Rufford Ln
- 11 St Austell Dr
- 8 Saint Austell Dr
- 217 Camborne Dr
- 175 Camborne Dr
- 43 Camborne Dr
- 16 Saint Austell Dr
- 1 Camborne Dr
- 10 Saint Austell Dr
- 5 St Austell Dr
- 5 Saint Austell Dr
- 5 Saint Austell Dr
- 5 Saint Austell Dr
- 0 Fowey Lane & Austell Dr
- 0 St Austell Dr & Fowey Ln Unit 1189478
- 7 Stratton Ln
- 3 Fowey Ln
- 1 Fowey Ln
- 8 Saint Agnes Ln
- 6 Saint Agnes Ln
- Lot 12 Stratton Ln