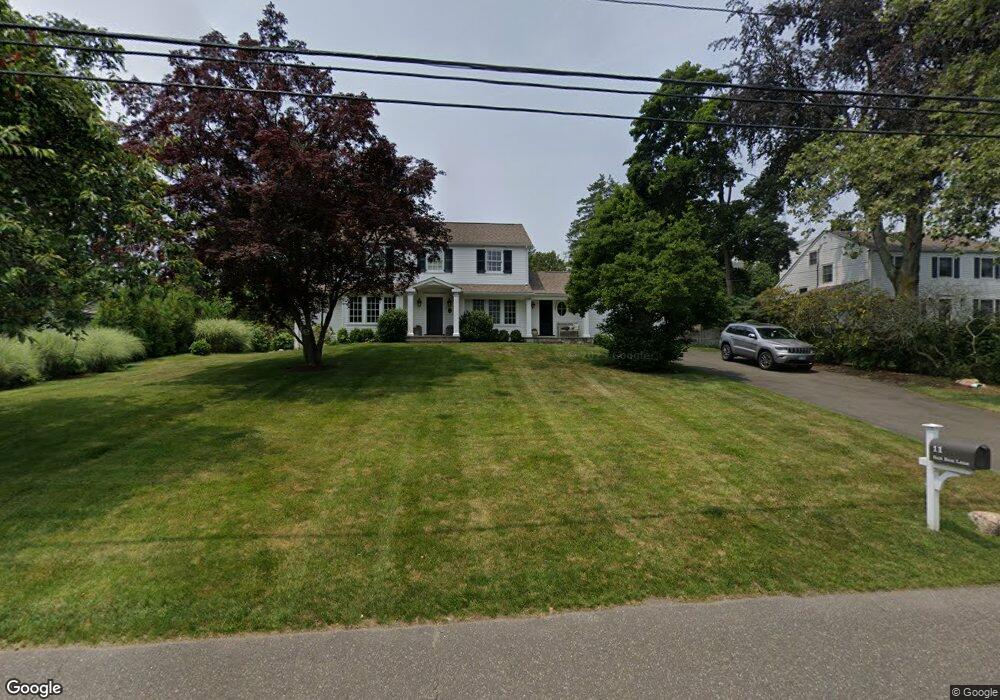
11 Salt Box Ln Darien, CT 06820
Estimated Value: $2,374,000 - $2,675,000
5
Beds
3
Baths
2,906
Sq Ft
$856/Sq Ft
Est. Value
About This Home
This home is located at 11 Salt Box Ln, Darien, CT 06820 and is currently estimated at $2,487,248, approximately $855 per square foot. 11 Salt Box Ln is a home located in Fairfield County with nearby schools including Hindley Elementary School, Middlesex Middle School, and Darien High School.
Ownership History
Date
Name
Owned For
Owner Type
Purchase Details
Closed on
Jul 17, 2012
Sold by
Mcdermott Mark C and Mcdermott Susan B
Bought by
Hackett William P and Hackett Erin E
Current Estimated Value
Home Financials for this Owner
Home Financials are based on the most recent Mortgage that was taken out on this home.
Original Mortgage
$825,000
Interest Rate
3.13%
Mortgage Type
Adjustable Rate Mortgage/ARM
Purchase Details
Closed on
May 23, 2001
Sold by
Walsh Sara A
Bought by
Mcdermott Mark C and Mcdermott Susan B
Create a Home Valuation Report for This Property
The Home Valuation Report is an in-depth analysis detailing your home's value as well as a comparison with similar homes in the area
Home Values in the Area
Average Home Value in this Area
Purchase History
| Date | Buyer | Sale Price | Title Company |
|---|---|---|---|
| Hackett William P | $1,100,000 | -- | |
| Mcdermott Mark C | $760,000 | -- |
Source: Public Records
Mortgage History
| Date | Status | Borrower | Loan Amount |
|---|---|---|---|
| Open | Mcdermott Mark C | $1,256,250 | |
| Closed | Mcdermott Mark C | $290,750 | |
| Closed | Mcdermott Mark C | $825,000 | |
| Previous Owner | Mcdermott Mark C | $359,650 |
Source: Public Records
Tax History Compared to Growth
Tax History
| Year | Tax Paid | Tax Assessment Tax Assessment Total Assessment is a certain percentage of the fair market value that is determined by local assessors to be the total taxable value of land and additions on the property. | Land | Improvement |
|---|---|---|---|---|
| 2025 | $18,952 | $1,224,300 | $602,700 | $621,600 |
| 2024 | $17,985 | $1,224,300 | $602,700 | $621,600 |
| 2023 | $17,024 | $966,700 | $430,500 | $536,200 |
| 2022 | $16,656 | $966,700 | $430,500 | $536,200 |
| 2021 | $4,981 | $966,700 | $430,500 | $536,200 |
| 2020 | $15,815 | $966,700 | $430,500 | $536,200 |
| 2019 | $5,293 | $966,700 | $430,500 | $536,200 |
| 2018 | $5,513 | $1,047,830 | $531,580 | $516,250 |
| 2017 | $8,450 | $1,047,830 | $531,580 | $516,250 |
| 2016 | $16,524 | $1,047,830 | $531,580 | $516,250 |
| 2015 | $12,696 | $827,120 | $531,580 | $295,540 |
| 2014 | $12,415 | $827,120 | $531,580 | $295,540 |
Source: Public Records
Map
Nearby Homes
- 32 Relihan Rd
- 77 Maple St
- 105 Houston Terrace
- 13 Patton Dr
- 166 Hollow Tree Ridge Rd
- 28 Aquila Rd
- 171 Sylvan Knoll Rd
- 163 Sylvan Knoll Rd
- 33 Dora St
- 209 Seaside Ave Unit 2
- 59 Courtland Ave Unit 2T
- 254 Seaside Ave Unit A
- 114 Sylvan Knoll Rd
- 104 Sylvan Knoll Rd
- 74 Standish Rd Unit 3
- 274 Sylvan Knoll Rd
- 421 Sylvan Knoll Rd
- 151 Courtland Ave Unit 6
- 151 Courtland Ave Unit 4
- 3 Dean St Unit B2