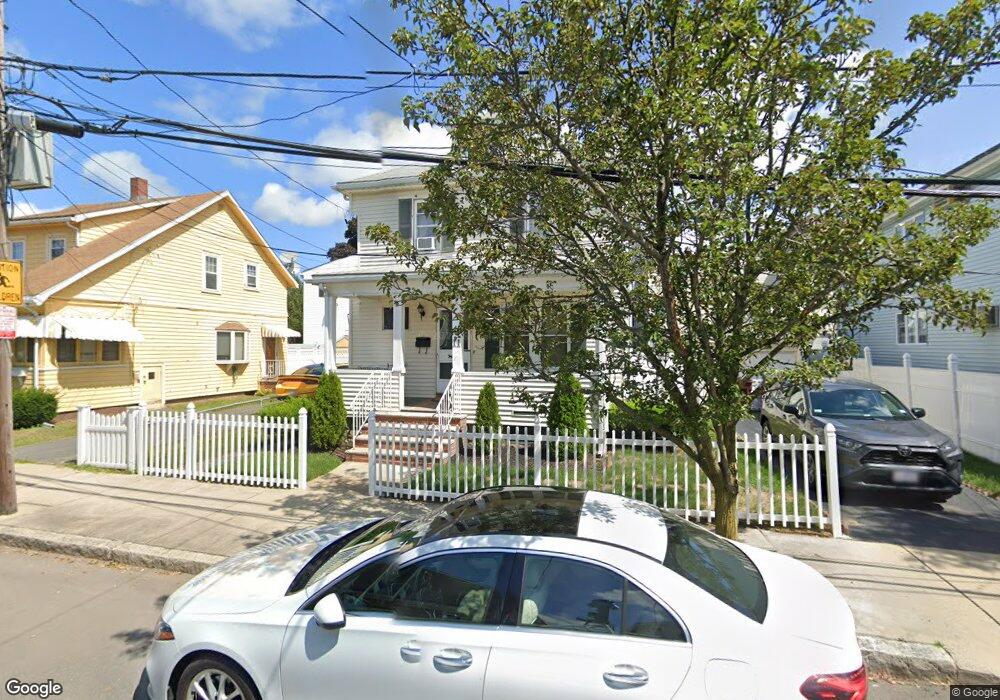
11 Sammet St Everett, MA 02149
Glendale NeighborhoodEstimated Value: $704,000 - $817,000
3
Beds
2
Baths
1,982
Sq Ft
$371/Sq Ft
Est. Value
About This Home
This home is located at 11 Sammet St, Everett, MA 02149 and is currently estimated at $735,331, approximately $371 per square foot. 11 Sammet St is a home located in Middlesex County with nearby schools including Malden High School.
Ownership History
Date
Name
Owned For
Owner Type
Purchase Details
Closed on
May 13, 2021
Sold by
Pereira-Franco Nilcea and Melo-Filho Alfredo
Bought by
Pereira-Franco Nilcea and Melo Victoria
Current Estimated Value
Home Financials for this Owner
Home Financials are based on the most recent Mortgage that was taken out on this home.
Original Mortgage
$109,600
Outstanding Balance
$77,844
Interest Rate
3.1%
Mortgage Type
Stand Alone Refi Refinance Of Original Loan
Estimated Equity
$657,487
Purchase Details
Closed on
Dec 17, 1996
Sold by
Agneta David F and Agneta Mary E
Bought by
Franco Nilcea P and Filho Alfredo M
Home Financials for this Owner
Home Financials are based on the most recent Mortgage that was taken out on this home.
Original Mortgage
$106,300
Interest Rate
7.75%
Mortgage Type
Purchase Money Mortgage
Create a Home Valuation Report for This Property
The Home Valuation Report is an in-depth analysis detailing your home's value as well as a comparison with similar homes in the area
Home Values in the Area
Average Home Value in this Area
Purchase History
| Date | Buyer | Sale Price | Title Company |
|---|---|---|---|
| Pereira-Franco Nilcea | -- | None Available | |
| Pereira-Franco Nilcea | -- | None Available | |
| Franco Nilcea P | $132,900 | -- | |
| Franco Nilcea P | $132,900 | -- |
Source: Public Records
Mortgage History
| Date | Status | Borrower | Loan Amount |
|---|---|---|---|
| Open | Pereira-Franco Nilcea | $109,600 | |
| Previous Owner | Franco Nilcea P | $106,300 | |
| Previous Owner | Franco Nilcea P | $75,000 |
Source: Public Records
Tax History Compared to Growth
Tax History
| Year | Tax Paid | Tax Assessment Tax Assessment Total Assessment is a certain percentage of the fair market value that is determined by local assessors to be the total taxable value of land and additions on the property. | Land | Improvement |
|---|---|---|---|---|
| 2025 | $7,365 | $646,600 | $246,800 | $399,800 |
| 2024 | $6,688 | $583,600 | $216,200 | $367,400 |
| 2023 | $6,520 | $553,500 | $206,800 | $346,700 |
| 2022 | $5,301 | $511,700 | $197,400 | $314,300 |
| 2021 | $4,642 | $470,300 | $176,700 | $293,600 |
| 2020 | $4,949 | $465,100 | $176,700 | $288,400 |
| 2019 | $5,062 | $408,900 | $168,300 | $240,600 |
| 2018 | $4,906 | $356,000 | $146,600 | $209,400 |
| 2017 | $4,642 | $321,500 | $131,600 | $189,900 |
| 2016 | $4,332 | $299,800 | $117,500 | $182,300 |
| 2015 | $4,081 | $279,300 | $106,000 | $173,300 |
Source: Public Records
Map
Nearby Homes
- 859 Broadway Unit 15
- 12 Holloway St
- 18 Lynn St
- 378 Ferry St
- 132 Vernal St
- 112 Hadley St
- 33 Lodgen Ct Unit 4G
- 8 Parker St Unit 8
- 10 Clay Ave
- 21 Hillside Ave Unit 21
- 272-274 Cross St Unit 1
- 272-274 Cross St Unit 4
- 272-274 Cross St Unit 3
- 272-274 Cross St Unit 5
- 272-274 Cross St Unit 2
- 13-15 Benner Ave
- 21 Central Ave Unit 10
- 40-42 Upham St Unit 1
- 21 Staples Ave Unit 26
- 20 Fairmount St