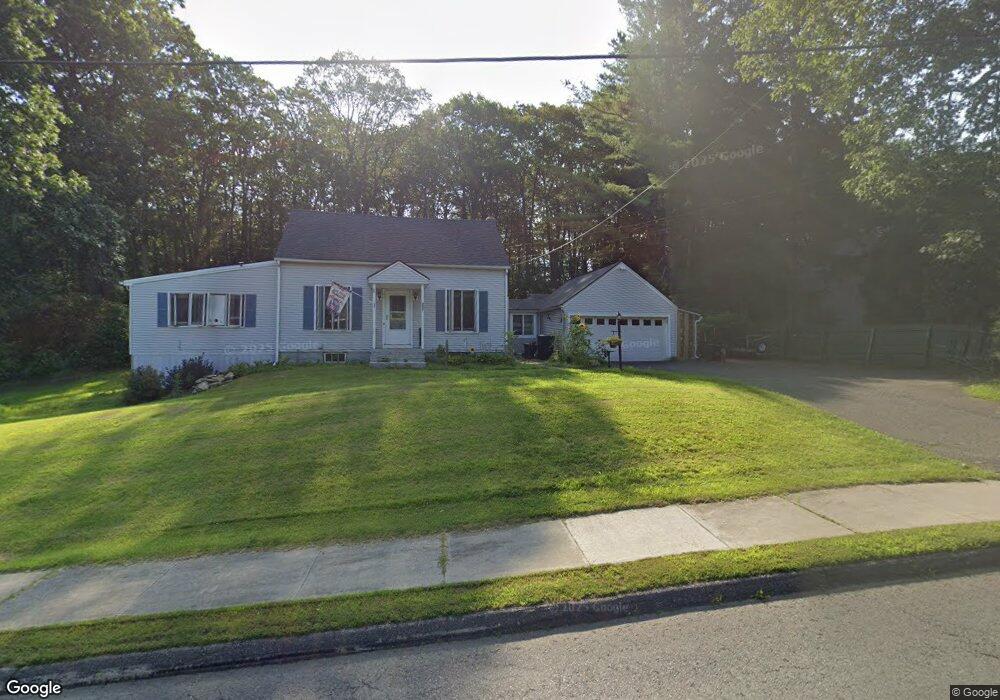
11 Scott Rd Terryville, CT 06786
Estimated Value: $331,031 - $352,000
3
Beds
2
Baths
1,080
Sq Ft
$317/Sq Ft
Est. Value
About This Home
This home is located at 11 Scott Rd, Terryville, CT 06786 and is currently estimated at $342,508, approximately $317 per square foot. 11 Scott Rd is a home located in Litchfield County with nearby schools including Plymouth Center School, Eli Terry Jr. Middle School, and Terryville High School.
Ownership History
Date
Name
Owned For
Owner Type
Purchase Details
Closed on
May 1, 2001
Sold by
Pfeuffer Richard A
Bought by
Baldwi George W and Baldwin Lillian P
Current Estimated Value
Home Financials for this Owner
Home Financials are based on the most recent Mortgage that was taken out on this home.
Original Mortgage
$50,000
Interest Rate
6.88%
Purchase Details
Closed on
Jun 2, 1997
Sold by
Sw Custom Homebuilers
Bought by
Pfeuffer Richard A
Purchase Details
Closed on
Jan 31, 1997
Sold by
Carrier Bernard and Carrier Nicole G
Bought by
Sw Custom Homebuilders
Create a Home Valuation Report for This Property
The Home Valuation Report is an in-depth analysis detailing your home's value as well as a comparison with similar homes in the area
Home Values in the Area
Average Home Value in this Area
Purchase History
| Date | Buyer | Sale Price | Title Company |
|---|---|---|---|
| Baldwi George W | $142,000 | -- | |
| Baldwi George W | $142,000 | -- | |
| Pfeuffer Richard A | $120,000 | -- | |
| Pfeuffer Richard A | $120,000 | -- | |
| Sw Custom Homebuilders | $25,000 | -- | |
| Sw Custom Homebuilders | $25,000 | -- |
Source: Public Records
Mortgage History
| Date | Status | Borrower | Loan Amount |
|---|---|---|---|
| Closed | Sw Custom Homebuilders | $50,000 | |
| Previous Owner | Sw Custom Homebuilders | $9,987 |
Source: Public Records
Tax History
| Year | Tax Paid | Tax Assessment Tax Assessment Total Assessment is a certain percentage of the fair market value that is determined by local assessors to be the total taxable value of land and additions on the property. | Land | Improvement |
|---|---|---|---|---|
| 2025 | $5,878 | $148,540 | $44,100 | $104,440 |
| 2024 | $5,740 | $148,540 | $44,100 | $104,440 |
| 2023 | $5,600 | $148,540 | $44,100 | $104,440 |
| 2022 | $5,395 | $148,540 | $44,100 | $104,440 |
| 2021 | $4,939 | $121,555 | $48,720 | $72,835 |
| 2020 | $4,939 | $121,555 | $48,720 | $72,835 |
| 2019 | $4,939 | $121,555 | $48,720 | $72,835 |
| 2016 | $4,222 | $117,208 | $48,720 | $68,488 |
| 2015 | $4,153 | $117,208 | $48,720 | $68,488 |
| 2014 | $4,085 | $117,208 | $48,720 | $68,488 |
Source: Public Records
Map
Nearby Homes
Your Personal Tour Guide
Ask me questions while you tour the home.