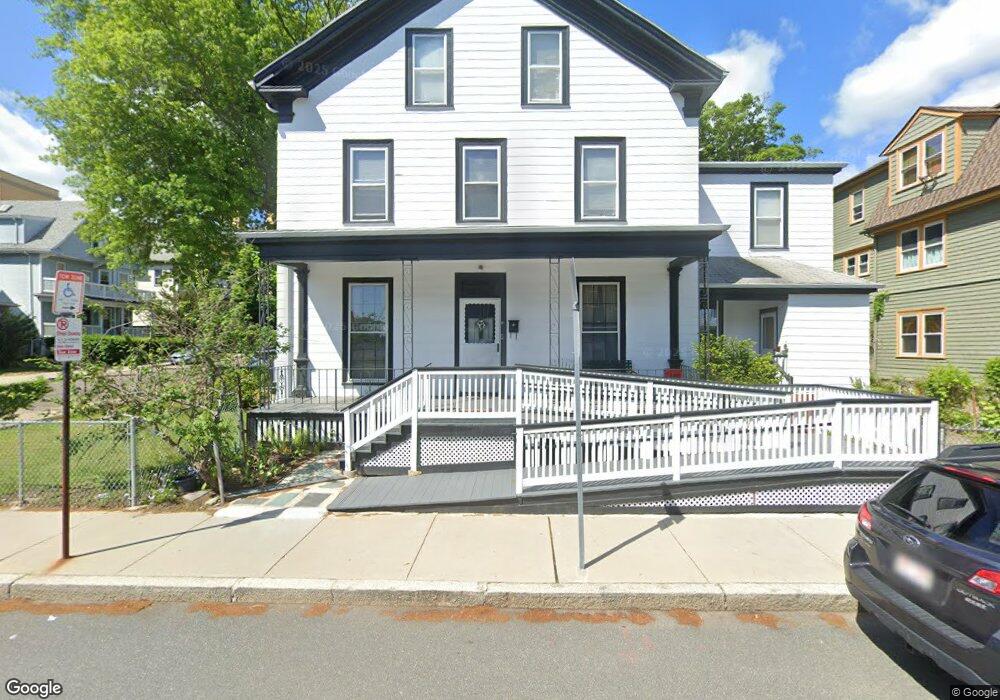
11 Seaborn St Dorchester Center, MA 02124
Saint Marks NeighborhoodEstimated Value: $1,078,732 - $1,190,000
8
Beds
3
Baths
4,272
Sq Ft
$264/Sq Ft
Est. Value
About This Home
This home is located at 11 Seaborn St, Dorchester Center, MA 02124 and is currently estimated at $1,128,683, approximately $264 per square foot. 11 Seaborn St is a home located in Suffolk County with nearby schools including Codman Academy Charter Public School.
Ownership History
Date
Name
Owned For
Owner Type
Purchase Details
Closed on
Mar 12, 2023
Sold by
Christmas-Thompson C
Bought by
Christmas Ft
Current Estimated Value
Purchase Details
Closed on
Aug 20, 2013
Sold by
Christmas Betty
Bought by
Christmas Betty and Thompson Crystal
Create a Home Valuation Report for This Property
The Home Valuation Report is an in-depth analysis detailing your home's value as well as a comparison with similar homes in the area
Home Values in the Area
Average Home Value in this Area
Purchase History
| Date | Buyer | Sale Price | Title Company |
|---|---|---|---|
| Christmas Ft | -- | None Available | |
| Christmas Betty | -- | -- |
Source: Public Records
Tax History Compared to Growth
Tax History
| Year | Tax Paid | Tax Assessment Tax Assessment Total Assessment is a certain percentage of the fair market value that is determined by local assessors to be the total taxable value of land and additions on the property. | Land | Improvement |
|---|---|---|---|---|
| 2025 | $9,609 | $829,800 | $267,100 | $562,700 |
| 2024 | $8,620 | $790,800 | $261,200 | $529,600 |
| 2023 | $7,789 | $725,200 | $239,500 | $485,700 |
| 2022 | $7,514 | $690,600 | $228,100 | $462,500 |
| 2021 | $7,369 | $690,600 | $228,100 | $462,500 |
| 2020 | $6,023 | $570,400 | $217,300 | $353,100 |
| 2019 | $5,465 | $518,500 | $166,400 | $352,100 |
| 2018 | $4,852 | $463,000 | $166,400 | $296,600 |
| 2017 | $4,903 | $463,000 | $166,400 | $296,600 |
| 2016 | $4,805 | $436,800 | $166,400 | $270,400 |
| 2015 | $3,750 | $309,700 | $109,000 | $200,700 |
| 2014 | $3,359 | $267,000 | $109,000 | $158,000 |
Source: Public Records
Map
Nearby Homes
- 52 Lithgow St Unit 2
- 61 Lyndhurst St Unit A
- 61 Lyndhurst St
- 123-125 Centre St Unit TH4
- 123-125 Centre St Unit TH 6
- 123-125 Centre St Unit TH2
- 57 Mather St
- 15-1/2 Tremlett St
- 19 Nixon St
- 1 Remington St
- 31 Tremlett St
- 23 Roseland St
- 26 Harley St Unit 1
- 52 Withington St Unit 7
- 25 Walton St
- 43 Withington St Unit 7
- 227 Centre St Unit 1
- 69 Ocean St
- 49 Alpha Rd
- 29 Torrey St
- 58 Centre St Unit 1
- 79 Seaborn St
- 54 Centre St
- 74 Centre St
- 50 Centre St
- 24 Moultrie St
- 63 Centre St
- 59 Centre St
- 59 Centre St
- 59 Centre St Unit PH
- 59 Centre St Unit 2
- 59 Centre St Unit 1
- 59 Centre St Unit A
- 8 Seaborn St
- 67 Centre St
- 76 Centre St
- 76 Centre St Unit 3
- 76 Centre St Unit 2
- 55 Centre St
- 55 Centre St Unit 3