
Landlord's Agent in 2019
Charlene Macdonald
The Gove Group Real Estate, LLC
(603) 867-8341
46 in this area
98 Total Sales


Estimated Value: $286,000 - $320,000
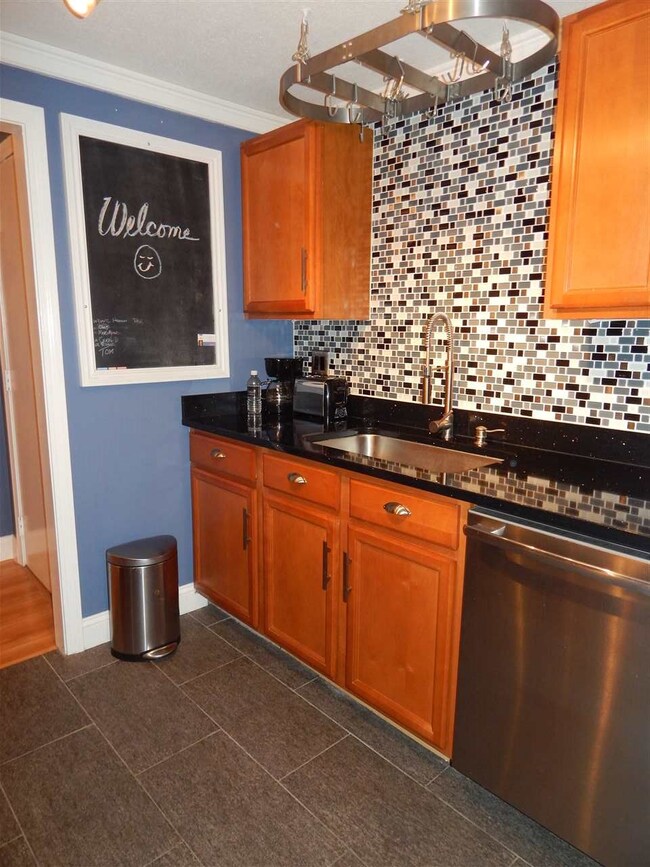
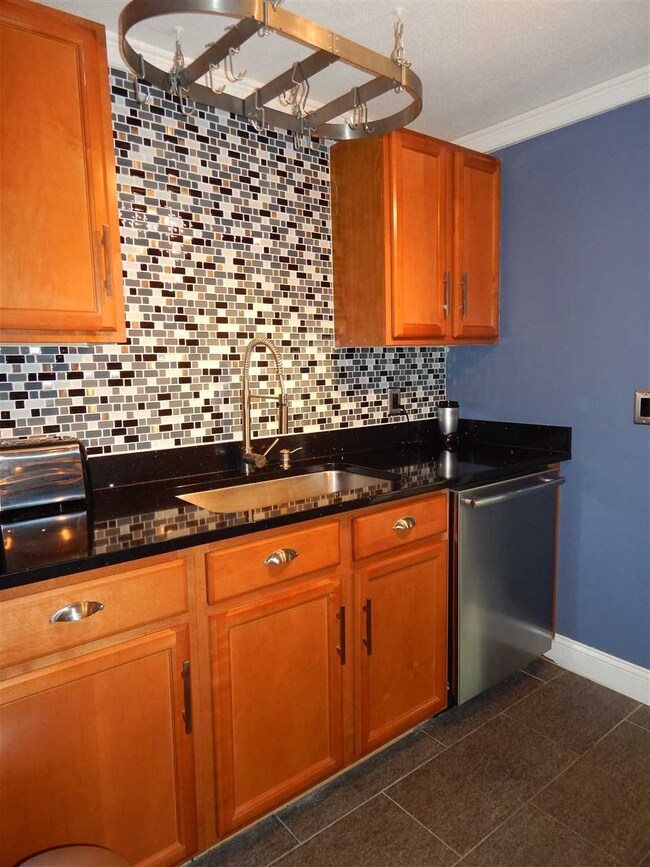
NO PETS PER CONDO RULES. NO SMOKERS PER OWNERS REQUEST. Nicely updated garden condo on the 3rd floor at Seabury. Large living room with dining area, updated kitchen with tile backsplash and stainless steel appliances. Two bedrooms with good closet space. Beautiful redone bath with walk in tile shower with glass doors. Great location close to shopping, schools beach and major highways.
Last Agent to Rent the Property
The Gove Group Real Estate, LLC License #052303 Listed on: 10/06/2019
Last Renter's Agent
The Gove Group Real Estate, LLC License #052303 Listed on: 10/06/2019
| Date | Buyer | Sale Price | Title Company |
|---|---|---|---|
| Brian P Caples Ret | -- | -- | |
| Caples Brian P | $115,000 | -- | |
| Chakoutis Nicholas P | $102,900 | -- | |
| Ritchie Lynn E | $44,500 | -- |
| Date | Status | Borrower | Loan Amount |
|---|---|---|---|
| Previous Owner | Ritchie Lynn E | $106,837 | |
| Previous Owner | Ritchie Lynn E | $82,300 | |
| Previous Owner | Ritchie Lynn E | $44,400 |
| Date | Event | Price | List to Sale | Price per Sq Ft | Prior Sale |
|---|---|---|---|---|---|
| 12/05/2019 12/05/19 | Rented | $1,400 | 0.0% | -- | |
| 10/28/2019 10/28/19 | Under Contract | -- | -- | -- | |
| 10/06/2019 10/06/19 | For Rent | $1,400 | 0.0% | -- | |
| 08/23/2019 08/23/19 | Sold | $160,000 | +3.2% | $198 / Sq Ft | View Prior Sale |
| 08/09/2019 08/09/19 | Pending | -- | -- | -- | |
| 08/05/2019 08/05/19 | For Sale | $155,000 | 0.0% | $191 / Sq Ft | |
| 12/09/2016 12/09/16 | Rented | $1,400 | -3.4% | -- | |
| 11/08/2016 11/08/16 | Under Contract | -- | -- | -- | |
| 10/11/2016 10/11/16 | For Rent | $1,450 | -- | -- |
| Year | Tax Paid | Tax Assessment Tax Assessment Total Assessment is a certain percentage of the fair market value that is determined by local assessors to be the total taxable value of land and additions on the property. | Land | Improvement |
|---|---|---|---|---|
| 2025 | $3,260 | $264,600 | $0 | $264,600 |
| 2024 | $3,260 | $264,600 | $0 | $264,600 |
| 2023 | $2,440 | $145,700 | $0 | $145,700 |
| 2022 | $2,308 | $145,700 | $0 | $145,700 |
| 2021 | $2,308 | $145,700 | $0 | $145,700 |
| 2020 | $2,321 | $145,700 | $0 | $145,700 |
| 2019 | $2,333 | $145,700 | $0 | $145,700 |
| 2018 | $2,138 | $125,600 | $0 | $125,600 |
| 2017 | $2,056 | $125,600 | $0 | $125,600 |
| 2016 | $2,020 | $125,600 | $0 | $125,600 |
Landlord's Agent in 2019
Charlene Macdonald
The Gove Group Real Estate, LLC
(603) 867-8341
46 in this area
98 Total Sales
Source: PrimeMLS
MLS Number: 4780097
APN: HMPT M:218 B:10 U:11
Disclaimer: Certain information contained herein is derived from information provided by parties other than Homes.com. All information provided is deemed reliable, but is not guaranteed to be accurate and should be independently verified.
![]() Copyright 2026 PrimeMLS, Inc. All rights reserved. This information is deemed reliable, but not guaranteed. The data relating to real estate displayed on this display comes in part from the IDX Program of PrimeMLS. The information being provided is for consumers’ personal, non-commercial use and may not be used for any purpose other than to identify prospective properties consumers may be interested in purchasing.
Copyright 2026 PrimeMLS, Inc. All rights reserved. This information is deemed reliable, but not guaranteed. The data relating to real estate displayed on this display comes in part from the IDX Program of PrimeMLS. The information being provided is for consumers’ personal, non-commercial use and may not be used for any purpose other than to identify prospective properties consumers may be interested in purchasing.
Ask me questions while you tour the home.