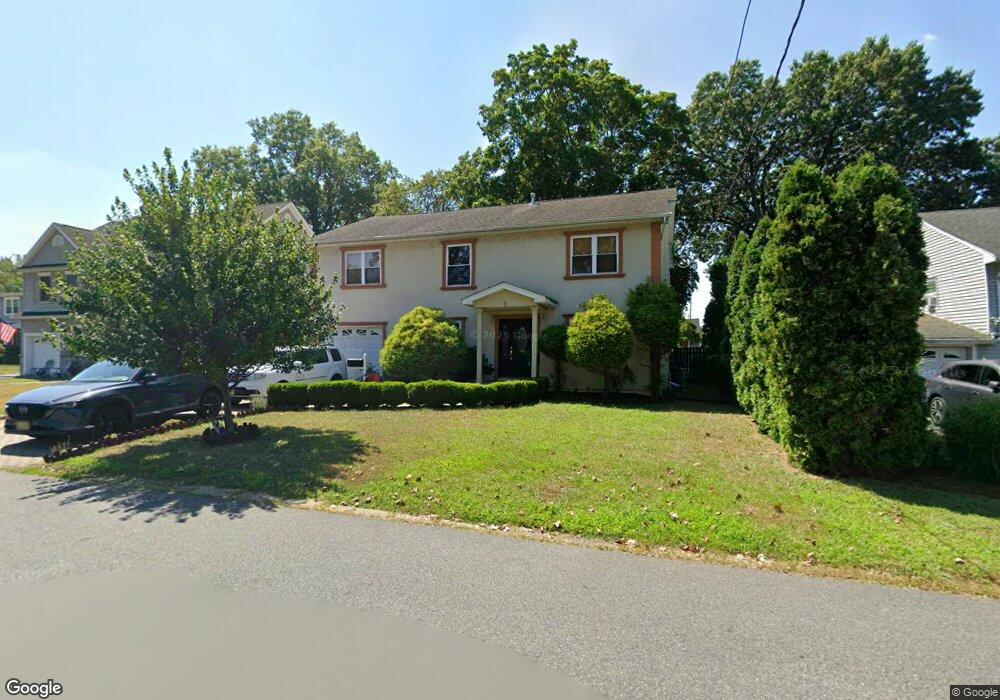
11 Seneca Ave Emerson, NJ 07630
Estimated Value: $815,435 - $1,063,000
Studio
--
Bath
2,590
Sq Ft
$360/Sq Ft
Est. Value
About This Home
This home is located at 11 Seneca Ave, Emerson, NJ 07630 and is currently estimated at $932,609, approximately $360 per square foot. 11 Seneca Ave is a home located in Bergen County with nearby schools including Memorial Elementary School, Patrick M. Villano Elementary School, and Emerson Jr Sr High School.
Ownership History
Date
Name
Owned For
Owner Type
Purchase Details
Closed on
Sep 12, 2008
Current Estimated Value
Purchase Details
Closed on
Jan 12, 2006
Sold by
Shpudejko Igor
Bought by
Vargas Jose
Home Financials for this Owner
Home Financials are based on the most recent Mortgage that was taken out on this home.
Original Mortgage
$439,000
Interest Rate
6.33%
Create a Home Valuation Report for This Property
The Home Valuation Report is an in-depth analysis detailing your home's value as well as a comparison with similar homes in the area
Home Values in the Area
Average Home Value in this Area
Purchase History
| Date | Buyer | Sale Price | Title Company |
|---|---|---|---|
| -- | $625,000 | -- | |
| Singit Anand | $625,005 | -- | |
| Vargas Jose | $439,000 | -- |
Source: Public Records
Mortgage History
| Date | Status | Borrower | Loan Amount |
|---|---|---|---|
| Previous Owner | Vargas Jose | $439,000 |
Source: Public Records
Tax History
| Year | Tax Paid | Tax Assessment Tax Assessment Total Assessment is a certain percentage of the fair market value that is determined by local assessors to be the total taxable value of land and additions on the property. | Land | Improvement |
|---|---|---|---|---|
| 2025 | $17,337 | $524,900 | $213,000 | $311,900 |
| 2024 | $16,881 | $524,900 | $213,000 | $311,900 |
| 2023 | $15,894 | $524,900 | $213,000 | $311,900 |
| 2022 | $15,894 | $524,900 | $213,000 | $311,900 |
| 2021 | $14,379 | $484,300 | $213,000 | $271,300 |
| 2020 | $14,098 | $484,300 | $213,000 | $271,300 |
| 2019 | $13,778 | $484,300 | $213,000 | $271,300 |
| 2018 | $13,158 | $484,300 | $213,000 | $271,300 |
| 2017 | $12,892 | $484,300 | $213,000 | $271,300 |
| 2016 | $12,611 | $484,300 | $213,000 | $271,300 |
| 2015 | $12,350 | $484,300 | $213,000 | $271,300 |
| 2014 | $12,088 | $484,300 | $213,000 | $271,300 |
Source: Public Records
Map
Nearby Homes
Your Personal Tour Guide
Ask me questions while you tour the home.