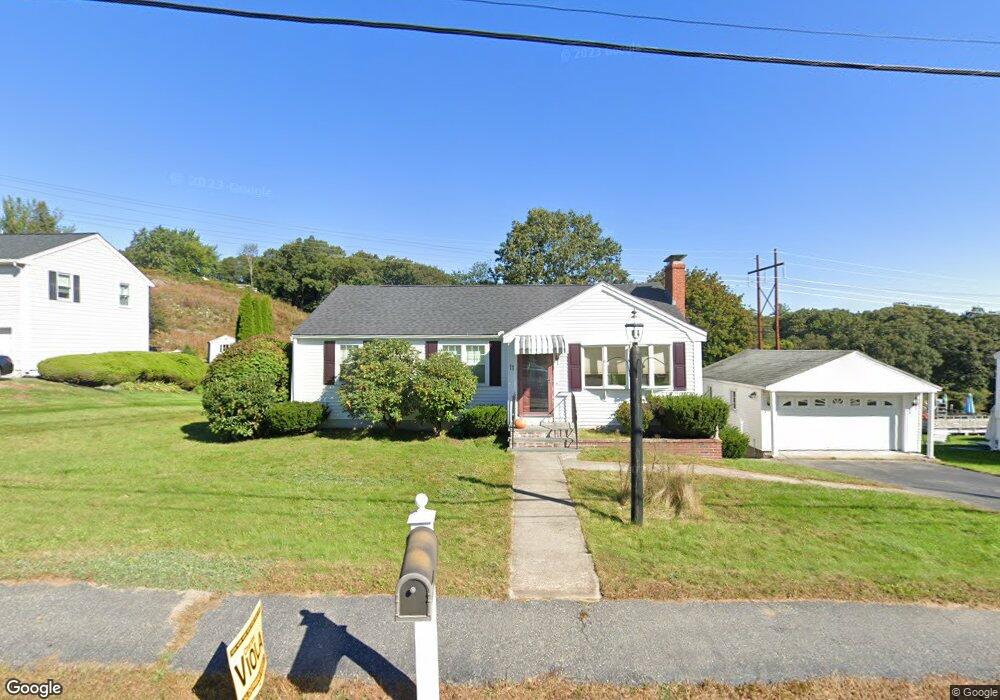
11 Seneca Rd Woburn, MA 01801
Shakerhill NeighborhoodEstimated Value: $685,000 - $718,000
3
Beds
1
Bath
987
Sq Ft
$706/Sq Ft
Est. Value
About This Home
This home is located at 11 Seneca Rd, Woburn, MA 01801 and is currently estimated at $697,052, approximately $706 per square foot. 11 Seneca Rd is a home located in Middlesex County with nearby schools including Reeves Elementary School, Daniel L. Joyce Middle School, and Woburn High School.
Ownership History
Date
Name
Owned For
Owner Type
Purchase Details
Closed on
Jan 10, 2017
Sold by
Otis Josephine M Est
Bought by
Otis James
Current Estimated Value
Home Financials for this Owner
Home Financials are based on the most recent Mortgage that was taken out on this home.
Original Mortgage
$207,000
Outstanding Balance
$170,147
Interest Rate
4.03%
Mortgage Type
New Conventional
Estimated Equity
$526,905
Purchase Details
Closed on
Nov 28, 2007
Sold by
Murdock Donna M and Drandson Mary E
Bought by
Otis Josephine M
Home Financials for this Owner
Home Financials are based on the most recent Mortgage that was taken out on this home.
Original Mortgage
$100,000
Interest Rate
6.48%
Mortgage Type
Purchase Money Mortgage
Create a Home Valuation Report for This Property
The Home Valuation Report is an in-depth analysis detailing your home's value as well as a comparison with similar homes in the area
Home Values in the Area
Average Home Value in this Area
Purchase History
| Date | Buyer | Sale Price | Title Company |
|---|---|---|---|
| Otis James | $257,000 | -- | |
| Otis Josephine M | $360,000 | -- | |
| Otis Josephine M | $360,000 | -- |
Source: Public Records
Mortgage History
| Date | Status | Borrower | Loan Amount |
|---|---|---|---|
| Open | Otis James | $207,000 | |
| Closed | Otis Josephine M | $207,000 | |
| Previous Owner | Otis Josephine M | $100,000 |
Source: Public Records
Tax History
| Year | Tax Paid | Tax Assessment Tax Assessment Total Assessment is a certain percentage of the fair market value that is determined by local assessors to be the total taxable value of land and additions on the property. | Land | Improvement |
|---|---|---|---|---|
| 2025 | $5,362 | $627,900 | $387,800 | $240,100 |
| 2024 | $4,913 | $609,600 | $369,500 | $240,100 |
| 2023 | $4,939 | $567,700 | $335,900 | $231,800 |
| 2022 | $4,786 | $512,400 | $292,500 | $219,900 |
| 2021 | $4,519 | $484,400 | $278,700 | $205,700 |
| 2020 | $4,283 | $459,500 | $278,700 | $180,800 |
| 2019 | $7,236 | $431,500 | $265,600 | $165,900 |
| 2018 | $3,956 | $400,000 | $243,900 | $156,100 |
| 2017 | $3,815 | $383,800 | $232,400 | $151,400 |
| 2016 | $3,635 | $361,700 | $217,400 | $144,300 |
| 2015 | $3,487 | $342,900 | $203,300 | $139,600 |
| 2014 | $3,271 | $313,300 | $203,300 | $110,000 |
Source: Public Records
Map
Nearby Homes
Your Personal Tour Guide
Ask me questions while you tour the home.