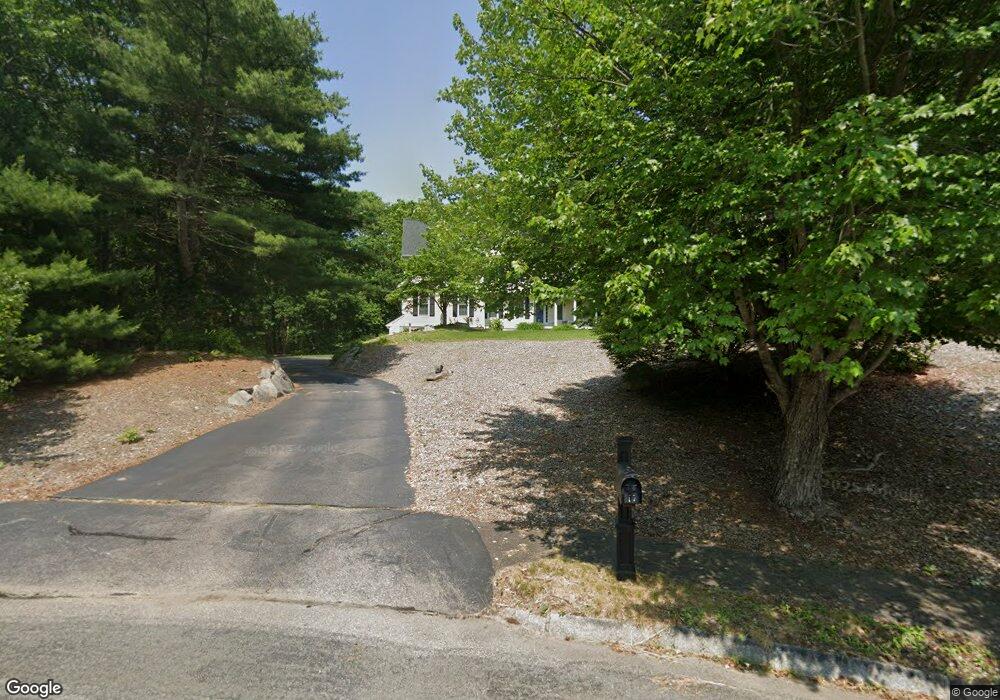
11 Serena Allen Way Mansfield, MA 02048
Estimated Value: $1,043,000 - $1,135,000
4
Beds
3
Baths
3,405
Sq Ft
$316/Sq Ft
Est. Value
About This Home
This home is located at 11 Serena Allen Way, Mansfield, MA 02048 and is currently estimated at $1,076,050, approximately $316 per square foot. 11 Serena Allen Way is a home located in Bristol County with nearby schools including Jordan/Jackson Elementary School, Everett W. Robinson Elementary School, and Harold L. Qualters Middle School.
Ownership History
Date
Name
Owned For
Owner Type
Purchase Details
Closed on
Jan 7, 2021
Sold by
Gilleran Jane A
Bought by
Gilleran Ft
Current Estimated Value
Purchase Details
Closed on
Aug 16, 2010
Sold by
Brunelli John P and Brunelli Cynthia A
Bought by
Gilleran Steven K and Gilleran Jane A
Home Financials for this Owner
Home Financials are based on the most recent Mortgage that was taken out on this home.
Original Mortgage
$417,000
Interest Rate
4.63%
Mortgage Type
Purchase Money Mortgage
Purchase Details
Closed on
Nov 6, 1992
Sold by
Nardone Serena A
Bought by
Brunelli John P and Brunelli Cynthia A
Create a Home Valuation Report for This Property
The Home Valuation Report is an in-depth analysis detailing your home's value as well as a comparison with similar homes in the area
Home Values in the Area
Average Home Value in this Area
Purchase History
| Date | Buyer | Sale Price | Title Company |
|---|---|---|---|
| Gilleran Ft | -- | None Available | |
| Gilleran Steven K | $570,000 | -- | |
| Brunelli John P | $69,900 | -- |
Source: Public Records
Mortgage History
| Date | Status | Borrower | Loan Amount |
|---|---|---|---|
| Previous Owner | Gilleran Steven K | $417,000 | |
| Previous Owner | Brunelli John P | $375,000 | |
| Previous Owner | Brunelli John P | $300,000 | |
| Previous Owner | Brunelli John P | $100,000 |
Source: Public Records
Tax History Compared to Growth
Tax History
| Year | Tax Paid | Tax Assessment Tax Assessment Total Assessment is a certain percentage of the fair market value that is determined by local assessors to be the total taxable value of land and additions on the property. | Land | Improvement |
|---|---|---|---|---|
| 2025 | $11,911 | $904,400 | $296,900 | $607,500 |
| 2024 | $11,614 | $860,300 | $309,600 | $550,700 |
| 2023 | $11,127 | $789,700 | $309,600 | $480,100 |
| 2022 | $10,671 | $703,400 | $287,100 | $416,300 |
| 2021 | $10,525 | $685,200 | $239,100 | $446,100 |
| 2020 | $10,340 | $673,200 | $239,100 | $434,100 |
| 2019 | $9,785 | $642,900 | $199,900 | $443,000 |
| 2018 | $9,339 | $625,900 | $191,000 | $434,900 |
| 2017 | $9,141 | $608,600 | $185,800 | $422,800 |
| 2016 | $8,745 | $567,500 | $176,900 | $390,600 |
| 2015 | $8,485 | $547,400 | $176,900 | $370,500 |
Source: Public Records
Map
Nearby Homes
- 261 East St
- 260 Massapoag Ave
- 25 Winter St
- 3 Cushing Ln
- 2 Red Fox Run
- 55-57 Pine Needle Ln
- 98 Massapoag Ave
- 5 Lauren Ln
- 12 Community Way
- 10 Erick Rd Unit 34
- 5 Pineview Terrace
- 29 Owl Ridge Rd
- 631 East St Unit H102
- 631 East St Unit B102
- 631 East St Unit E101
- 4 Shadybrook Ln
- 130 Morse St
- 35 Independence Dr Unit 35
- 89 Massapoag Ave
- 46 Kerry Dr