Estimated Value: $175,933 - $183,000
Studio
2
Baths
1,243
Sq Ft
$145/Sq Ft
Est. Value
About This Home
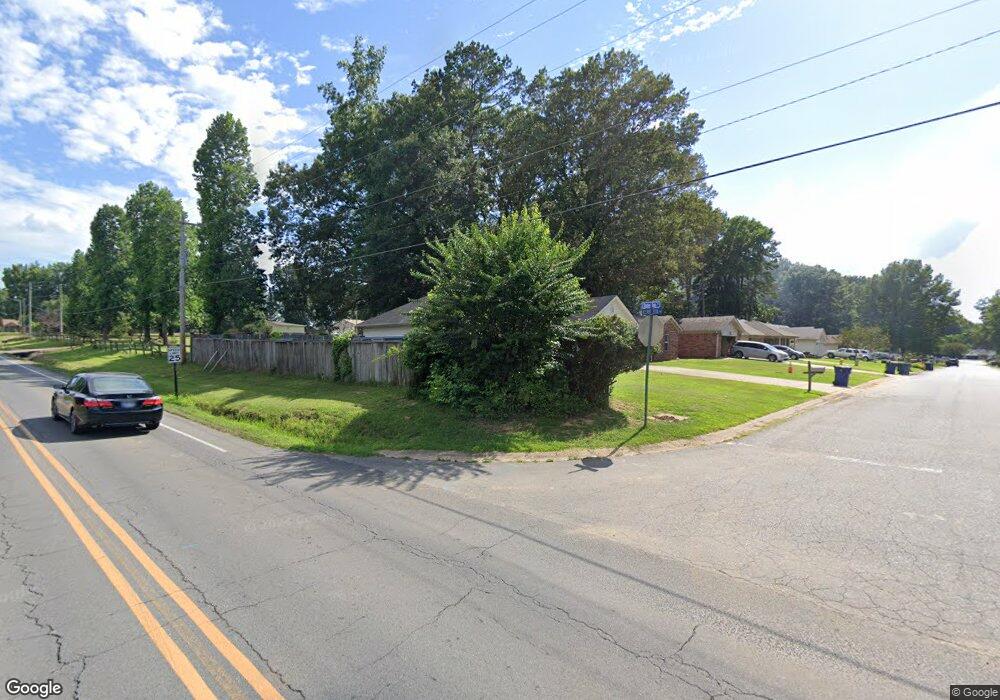
This home is located at 11 Shaded Oaks Dr, Cabot, AR 72023 and is currently estimated at $179,733, approximately $144 per square foot. 11 Shaded Oaks Dr is a home located in Lonoke County with nearby schools including Central Elementary School, Cabot Junior High South, and Cabot Middle School South.
Ownership History
Date
Name
Owned For
Owner Type
Purchase Details
Closed on
Nov 21, 2017
Sold by
Nash Mary E and Nash Michael
Bought by
Homsley Stacy Denise and Barkman Amber B
Current Estimated Value
Home Financials for this Owner
Home Financials are based on the most recent Mortgage that was taken out on this home.
Original Mortgage
$106,969
Outstanding Balance
$89,847
Interest Rate
3.94%
Mortgage Type
New Conventional
Estimated Equity
$89,886
Purchase Details
Closed on
Aug 31, 2009
Sold by
Cooper Deborah K and Wallace Deborah K
Bought by
Gober Mary E
Home Financials for this Owner
Home Financials are based on the most recent Mortgage that was taken out on this home.
Original Mortgage
$107,100
Interest Rate
5.26%
Purchase Details
Closed on
May 6, 1999
Bought by
Wallace
Purchase Details
Closed on
Nov 12, 1997
Bought by
Ba Plat D and Ba 122
Create a Home Valuation Report for This Property
The Home Valuation Report is an in-depth analysis detailing your home's value as well as a comparison with similar homes in the area
Purchase History
| Date | Buyer | Sale Price | Title Company |
|---|---|---|---|
| Homsley Stacy Denise | $105,900 | None Available | |
| Gober Mary E | -- | Realty Title | |
| Wallace | $84,000 | -- | |
| Wallace | $84,000 | -- | |
| Ba Plat D | -- | -- |
Source: Public Records
Mortgage History
| Date | Status | Borrower | Loan Amount |
|---|---|---|---|
| Open | Homsley Stacy Denise | $106,969 | |
| Previous Owner | Gober Mary E | $107,100 |
Source: Public Records
Tax History
| Year | Tax Paid | Tax Assessment Tax Assessment Total Assessment is a certain percentage of the fair market value that is determined by local assessors to be the total taxable value of land and additions on the property. | Land | Improvement |
|---|---|---|---|---|
| 2025 | $583 | $19,800 | $2,600 | $17,200 |
| 2024 | $583 | $19,800 | $2,600 | $17,200 |
| 2023 | $583 | $19,800 | $2,600 | $17,200 |
| 2022 | $633 | $19,800 | $2,600 | $17,200 |
| 2021 | $633 | $19,800 | $2,600 | $17,200 |
| 2020 | $585 | $18,860 | $2,600 | $16,260 |
| 2019 | $585 | $18,860 | $2,600 | $16,260 |
| 2018 | $582 | $18,860 | $2,600 | $16,260 |
| 2017 | $866 | $18,860 | $2,600 | $16,260 |
| 2016 | $582 | $18,860 | $2,600 | $16,260 |
| 2015 | $543 | $18,070 | $2,600 | $15,470 |
| 2014 | $543 | $18,070 | $2,600 | $15,470 |
Source: Public Records
Map
Nearby Homes
- 19 Talladega Dr
- 105 Earnhardt Cir
- 12 Daytona
- 45 Winners Cir
- 35 Warren St
- Lots 44 &45 Broadmoor Cir
- Lot 107 Southhaven
- 11 Dale Ct
- 15 Judith Ct
- 507 Southhaven Ave
- 11 Warren St
- 00 Plaza Blvd
- 0 Highway 321 Unit 21612963
- 12 Michael Dr
- 1309 S Pine St
- 4 Beechwood St
- 34 Bent Tree Dr
- 1 Bill Foster Memorial Hwy E
- 10 Bill Foster Memorial Hwy E
- 2702 Bill Foster Memorial Hwy E Unit Hwy 321
- 13 Shaded Oaks Dr
- 15 Shaded Oaks Dr
- 0 Shaded Oaks
- 12 Shaded Oaks Dr
- 10 Shaded Oaks Dr
- 17 Shaded Oaks Dr
- 15 Talladega Dr
- 14 Shaded Oaks Dr
- 115 Earnhardt Cir
- 2205 Kerr Station Rd
- 13 Talladega Dr
- 16 Shaded Oaks Dr
- 0 Talladega Earnhart Unit 24-1312
- 19 Shaded Oaks Dr
- 113 Earnhardt Cir
- 20 Talladega Dr
- 18 Shaded Oaks Dr
- 18 Talladega Dr
- 11 Talladega Dr
- 21 Shaded Oaks Dr
Your Personal Tour Guide
Ask me questions while you tour the home.