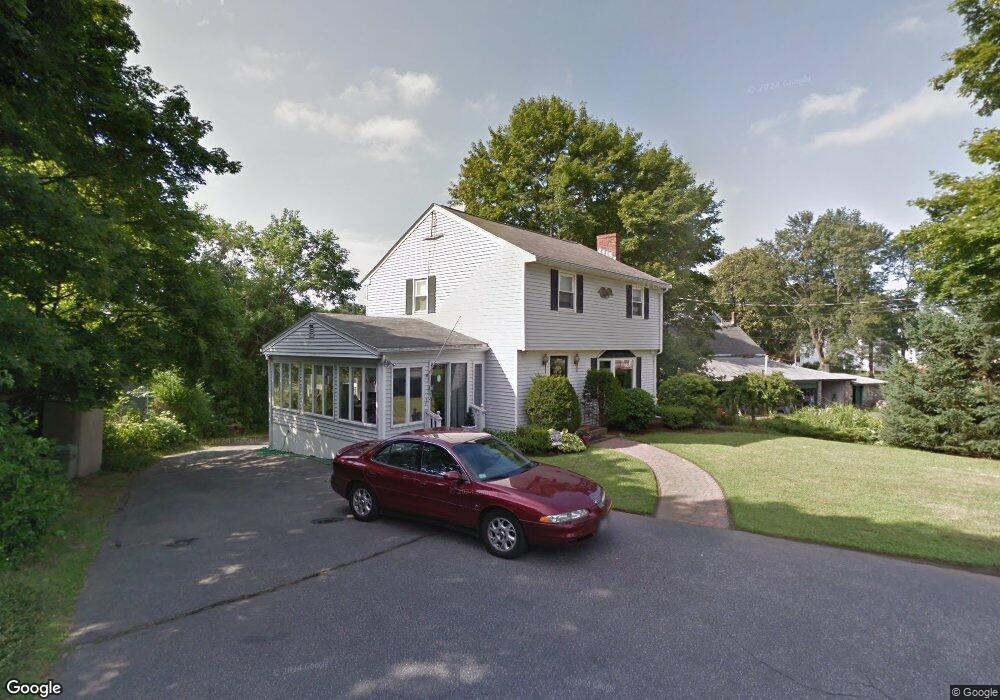
11 Sherman Place Ct Woburn, MA 01801
Downtown Woburn NeighborhoodEstimated Value: $657,000 - $710,000
3
Beds
2
Baths
1,372
Sq Ft
$498/Sq Ft
Est. Value
About This Home
This home is located at 11 Sherman Place Ct, Woburn, MA 01801 and is currently estimated at $682,858, approximately $497 per square foot. 11 Sherman Place Ct is a home located in Middlesex County with nearby schools including Malcolm White Elementary School, John F. Kennedy Middle School, and Woburn High School.
Ownership History
Date
Name
Owned For
Owner Type
Purchase Details
Closed on
Jul 1, 2025
Sold by
Comer Ft and Bowen
Bought by
Comer Hayley A and Wettengel Philip F
Current Estimated Value
Purchase Details
Closed on
Oct 20, 2004
Sold by
Comer Dorothea P
Bought by
Comer Ft and Comer
Create a Home Valuation Report for This Property
The Home Valuation Report is an in-depth analysis detailing your home's value as well as a comparison with similar homes in the area
Home Values in the Area
Average Home Value in this Area
Purchase History
| Date | Buyer | Sale Price | Title Company |
|---|---|---|---|
| Comer Hayley A | $650,000 | -- | |
| Comer Hayley A | $650,000 | -- | |
| Comer Ft | -- | -- | |
| Comer Ft | -- | -- | |
| Comer Ft | -- | -- |
Source: Public Records
Mortgage History
| Date | Status | Borrower | Loan Amount |
|---|---|---|---|
| Previous Owner | Comer Ft | $34,400 |
Source: Public Records
Tax History Compared to Growth
Tax History
| Year | Tax Paid | Tax Assessment Tax Assessment Total Assessment is a certain percentage of the fair market value that is determined by local assessors to be the total taxable value of land and additions on the property. | Land | Improvement |
|---|---|---|---|---|
| 2025 | $5,477 | $641,300 | $368,200 | $273,100 |
| 2024 | $5,050 | $626,500 | $350,700 | $275,800 |
| 2023 | $4,931 | $566,800 | $318,800 | $248,000 |
| 2022 | $4,765 | $510,200 | $277,300 | $232,900 |
| 2021 | $4,566 | $489,400 | $264,100 | $225,300 |
| 2020 | $4,432 | $475,500 | $264,100 | $211,400 |
| 2019 | $4,253 | $447,700 | $251,500 | $196,200 |
| 2018 | $4,094 | $414,000 | $230,800 | $183,200 |
| 2017 | $3,866 | $388,900 | $219,800 | $169,100 |
| 2016 | $3,687 | $366,900 | $205,500 | $161,400 |
| 2015 | $3,541 | $348,200 | $192,000 | $156,200 |
| 2014 | $3,486 | $333,900 | $192,000 | $141,900 |
Source: Public Records
Map
Nearby Homes
- 1 Boline Place
- 18 Gardner Ave
- 3 Laurel St
- 2 Eastern Ave
- 51 Vernon St
- 62 Jefferson Ave
- 74 Beach St Unit 6-12
- 74 Beach St Unit 3
- 3 Frank St
- 69 Eastern Ave
- 9 Wade Ave
- 18 Carmen Terrace
- 39 Garfield Ave
- 34 Union St
- 64 Garfield Ave
- 477 Main St
- 18 Church St Unit 2
- 7 Prospect St
- 35 Prospect St Unit 215
- 35 Prospect St Unit 204
- 4 Ingalls St
- 148 Montvale Ave
- 2 Ingalls St
- 7 Sherman Place Ct
- 144 Montvale Ave
- 150 Montvale Ave
- 8 Sherman Place Ct
- 8 Sherman Place Ct Unit 2
- 6 Ingalls St
- 6 Sherman Place Ct
- 142 Montvale Ave
- 8 Ingalls St
- 5 Ingalls St
- 11 Sherman Place
- 1 Ingalls St
- 7 Sherman Place
- 15 Sherman Place
- 145 Montvale Ave
- 143 Montvale Ave
- 138 Montvale Ave