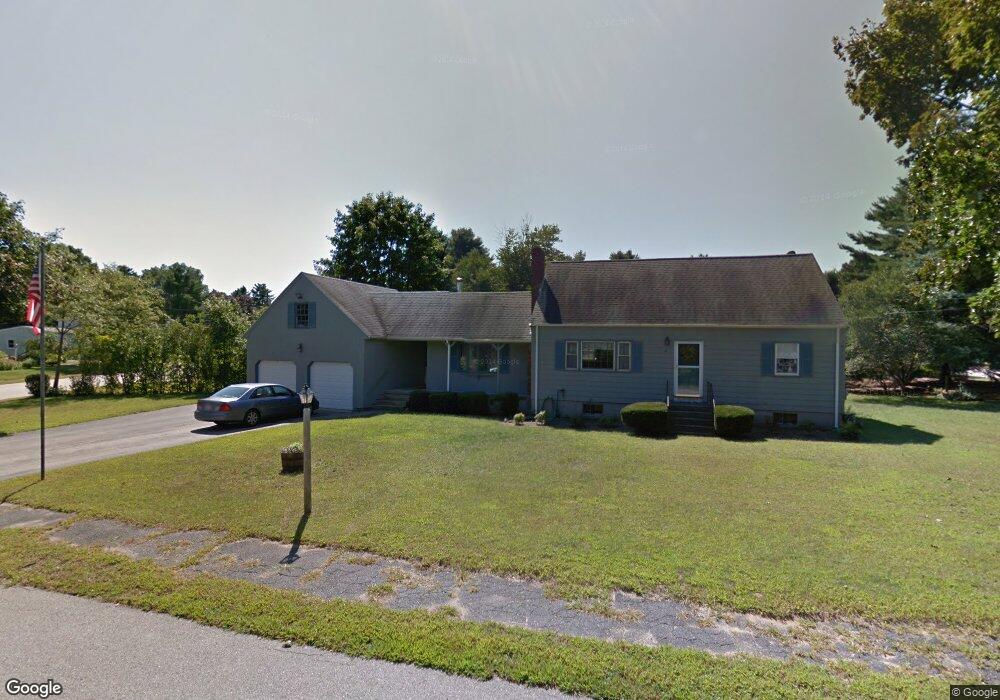
11 Sherman Rd Millis, MA 02054
Estimated Value: $661,000 - $709,000
4
Beds
2
Baths
1,843
Sq Ft
$373/Sq Ft
Est. Value
About This Home
This home is located at 11 Sherman Rd, Millis, MA 02054 and is currently estimated at $687,786, approximately $373 per square foot. 11 Sherman Rd is a home located in Norfolk County with nearby schools including Clyde F Brown, Millis Middle School, and Millis High School.
Ownership History
Date
Name
Owned For
Owner Type
Purchase Details
Closed on
Nov 25, 2009
Sold by
Held Joseph L and Held Mary J
Bought by
Oneill Douglas J and Oneill Lisa E
Current Estimated Value
Home Financials for this Owner
Home Financials are based on the most recent Mortgage that was taken out on this home.
Original Mortgage
$342,388
Outstanding Balance
$223,554
Interest Rate
4.92%
Mortgage Type
Purchase Money Mortgage
Estimated Equity
$464,232
Create a Home Valuation Report for This Property
The Home Valuation Report is an in-depth analysis detailing your home's value as well as a comparison with similar homes in the area
Home Values in the Area
Average Home Value in this Area
Purchase History
| Date | Buyer | Sale Price | Title Company |
|---|---|---|---|
| Oneill Douglas J | $355,000 | -- |
Source: Public Records
Mortgage History
| Date | Status | Borrower | Loan Amount |
|---|---|---|---|
| Open | Oneill Douglas J | $342,388 |
Source: Public Records
Tax History
| Year | Tax Paid | Tax Assessment Tax Assessment Total Assessment is a certain percentage of the fair market value that is determined by local assessors to be the total taxable value of land and additions on the property. | Land | Improvement |
|---|---|---|---|---|
| 2025 | $9,807 | $598,000 | $236,700 | $361,300 |
| 2024 | $8,993 | $547,700 | $218,500 | $329,200 |
| 2023 | $8,379 | $479,100 | $174,100 | $305,000 |
| 2022 | $8,413 | $445,600 | $186,800 | $258,800 |
| 2021 | $7,744 | $394,700 | $161,500 | $233,200 |
| 2020 | $8,010 | $397,700 | $150,900 | $246,800 |
| 2019 | $6,981 | $373,300 | $138,200 | $235,100 |
| 2018 | $6,727 | $373,300 | $138,200 | $235,100 |
| 2017 | $6,246 | $339,100 | $119,200 | $219,900 |
| 2016 | $5,914 | $339,100 | $119,200 | $219,900 |
| 2015 | $5,765 | $339,100 | $119,200 | $219,900 |
Source: Public Records
Map
Nearby Homes
- 25 Bayberry Cir Unit 25
- 20 Hemlock Cir
- 64 Village St
- 11 Parnell St
- 227 Village St
- 5 Apple Rock Rd
- 33 Spencer St
- 324 Union St Unit 1
- 43 Whichita Rd
- 6 Rosenfeld Rd
- 14 Teresa Dr
- 6 April Way
- 22 May Rd
- 10 April Way
- 13 Teresa Dr
- 18 Shawnee Rd
- 188 Pleasant St
- 33 Whichita Rd
- 200 Pleasant St
- 28 Key St Unit 28
Your Personal Tour Guide
Ask me questions while you tour the home.