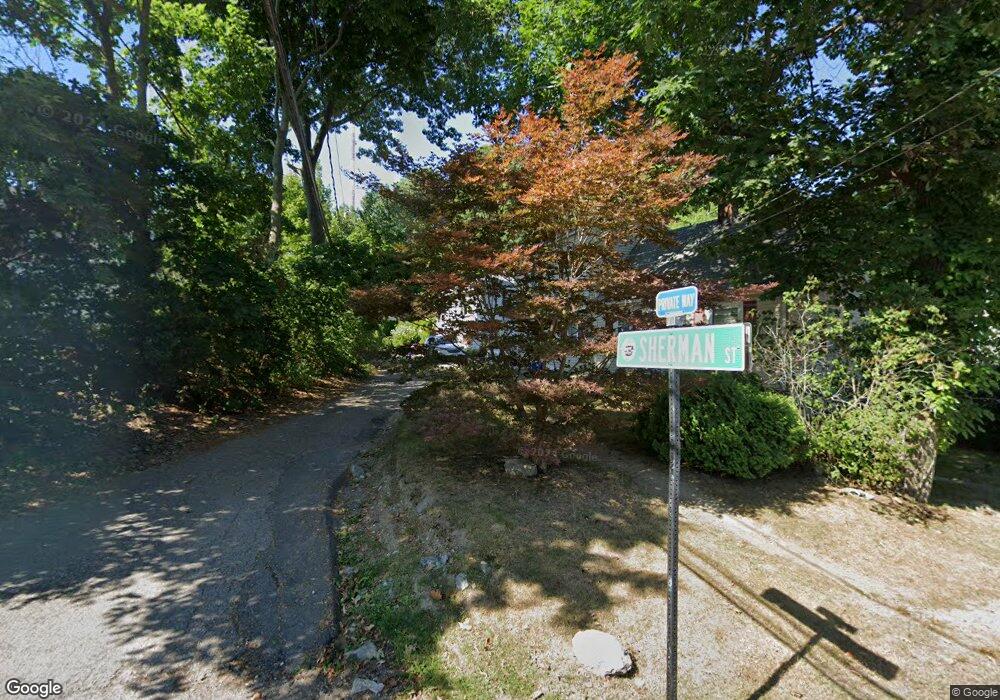
11 Sherman St Needham Heights, MA 02494
Estimated Value: $739,000 - $1,070,768
2
Beds
2
Baths
1,200
Sq Ft
$748/Sq Ft
Est. Value
About This Home
This home is located at 11 Sherman St, Needham Heights, MA 02494 and is currently estimated at $897,692, approximately $748 per square foot. 11 Sherman St is a home located in Norfolk County with nearby schools including Eliot Elementary School, High Rock Middle School, and Pollard Middle School.
Ownership History
Date
Name
Owned For
Owner Type
Purchase Details
Closed on
Jul 23, 2015
Sold by
Vega Julio E
Bought by
Conti David
Current Estimated Value
Home Financials for this Owner
Home Financials are based on the most recent Mortgage that was taken out on this home.
Original Mortgage
$320,000
Outstanding Balance
$250,818
Interest Rate
4.01%
Mortgage Type
New Conventional
Estimated Equity
$646,874
Purchase Details
Closed on
Aug 1, 2007
Sold by
Mordo William and Mordo Christine
Bought by
Vega Julio E
Create a Home Valuation Report for This Property
The Home Valuation Report is an in-depth analysis detailing your home's value as well as a comparison with similar homes in the area
Home Values in the Area
Average Home Value in this Area
Purchase History
| Date | Buyer | Sale Price | Title Company |
|---|---|---|---|
| Conti David | $400,000 | -- | |
| Vega Julio E | $269,000 | -- |
Source: Public Records
Mortgage History
| Date | Status | Borrower | Loan Amount |
|---|---|---|---|
| Open | Conti David | $320,000 |
Source: Public Records
Tax History Compared to Growth
Tax History
| Year | Tax Paid | Tax Assessment Tax Assessment Total Assessment is a certain percentage of the fair market value that is determined by local assessors to be the total taxable value of land and additions on the property. | Land | Improvement |
|---|---|---|---|---|
| 2025 | $8,745 | $825,000 | $708,700 | $116,300 |
| 2024 | $6,125 | $489,200 | $366,700 | $122,500 |
| 2023 | $6,255 | $479,700 | $366,700 | $113,000 |
| 2022 | $5,952 | $445,200 | $336,900 | $108,300 |
| 2021 | $5,801 | $445,200 | $336,900 | $108,300 |
| 2020 | $5,427 | $434,500 | $336,900 | $97,600 |
| 2019 | $4,984 | $402,300 | $306,800 | $95,500 |
| 2018 | $4,779 | $402,300 | $306,800 | $95,500 |
| 2017 | $4,654 | $391,400 | $306,800 | $84,600 |
| 2016 | $4,108 | $356,000 | $271,400 | $84,600 |
| 2015 | $4,019 | $356,000 | $271,400 | $84,600 |
| 2014 | $3,406 | $292,600 | $212,400 | $80,200 |
Source: Public Records
Map
Nearby Homes
- 181 Saint Mary St
- 45 River Ave Unit 45
- 989 Chestnut St Unit 8
- 992 Chestnut St
- 968 Chestnut St
- 925 Chestnut St
- 6 Willow St
- 84-86 Pennsylvania Ave Unit 1
- 331 Elliot St
- 21 Hale St Unit 21
- 873 Chestnut St
- 206 Cedar St
- 19 High St Unit 23
- 51 Pettee St Unit 11
- 51 Pettee St Unit 13
- 304 Elliot St Carriage House S Unit 4
- 302 Elliot St Carriage House N Unit 3
- 300 Elliot St Unit 2
- 829 Chestnut St
- 66 Rockland Place
- 27 Sherman St
- 20 Sherman St
- 20 Sherman St Unit 20
- 187 Saint Mary St
- 169 Saint Mary St
- 193 Saint Mary St
- 26 Sherman St
- 26 Sherman St Unit A
- 26 Sherman St Unit 26
- 109 Saint Mary St
- 28 Sherman St
- 28 Sherman St Unit 2
- 161 Saint Mary St
- 31 Sherman St
- 37 Sherman St
- 180 Saint Mary St
- 209 Saint Mary St Unit A3
- 209 Saint Mary St Unit A2
- 209 Saint Mary St Unit A1
- 209 St Mary St Unit A3