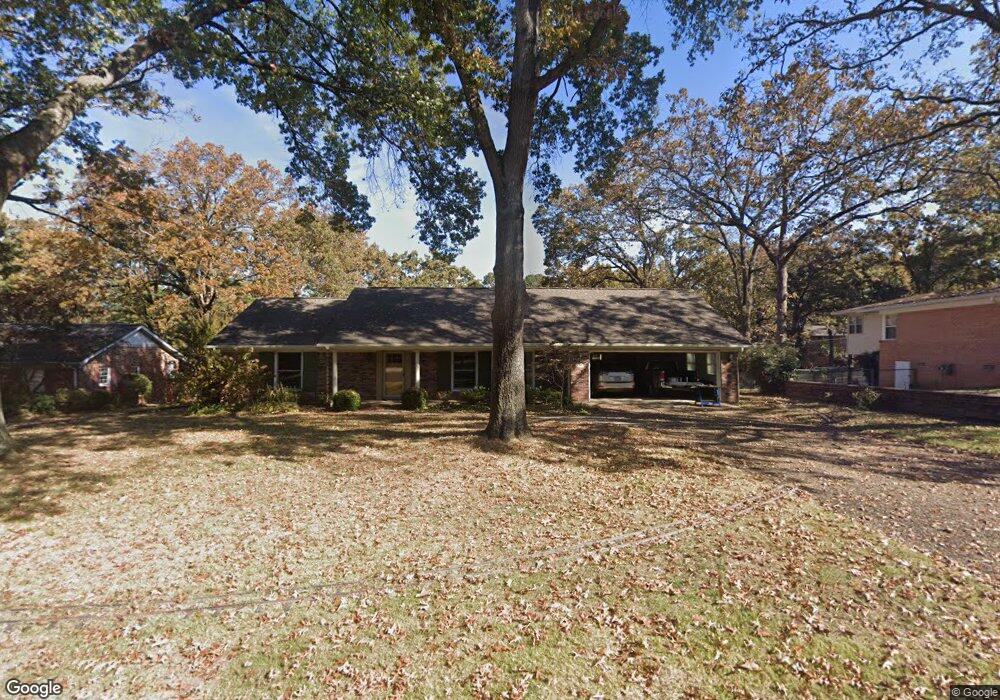
11 Shore Point Rd North Little Rock, AR 72116
Lakewood NeighborhoodEstimated Value: $306,272 - $374,000
--
Bed
2
Baths
3,186
Sq Ft
$108/Sq Ft
Est. Value
About This Home
This home is located at 11 Shore Point Rd, North Little Rock, AR 72116 and is currently estimated at $343,318, approximately $107 per square foot. 11 Shore Point Rd is a home located in Pulaski County with nearby schools including Lakewood Elementary School, North Little Rock Middle School 6th Grade Campus, and North Little Rock High School.
Ownership History
Date
Name
Owned For
Owner Type
Purchase Details
Closed on
Aug 7, 2012
Sold by
Hobbs William Gordon and Hobbs Grace Hsu
Bought by
Hobbs William Gordon and Hobbs Grace Hsu
Current Estimated Value
Create a Home Valuation Report for This Property
The Home Valuation Report is an in-depth analysis detailing your home's value as well as a comparison with similar homes in the area
Home Values in the Area
Average Home Value in this Area
Purchase History
| Date | Buyer | Sale Price | Title Company |
|---|---|---|---|
| Hobbs William Gordon | -- | None Available |
Source: Public Records
Tax History Compared to Growth
Tax History
| Year | Tax Paid | Tax Assessment Tax Assessment Total Assessment is a certain percentage of the fair market value that is determined by local assessors to be the total taxable value of land and additions on the property. | Land | Improvement |
|---|---|---|---|---|
| 2025 | $2,816 | $53,674 | $8,400 | $45,274 |
| 2024 | $2,816 | $53,674 | $8,400 | $45,274 |
| 2023 | $2,816 | $53,674 | $8,400 | $45,274 |
| 2022 | $3,018 | $53,674 | $8,400 | $45,274 |
| 2021 | $3,014 | $42,160 | $5,400 | $36,760 |
| 2020 | $2,636 | $42,160 | $5,400 | $36,760 |
| 2019 | $2,632 | $42,160 | $5,400 | $36,760 |
| 2018 | $2,653 | $42,160 | $5,400 | $36,760 |
| 2017 | $2,653 | $42,160 | $5,400 | $36,760 |
| 2016 | $2,971 | $44,480 | $6,040 | $38,440 |
| 2015 | $2,971 | $44,480 | $6,040 | $38,440 |
| 2014 | $2,971 | $44,480 | $6,040 | $38,440 |
Source: Public Records
Map
Nearby Homes
- 3111 Lakeview Rd
- 3605 N Hills Blvd
- 2701 Donaghey Dr
- 2 Lakewood Park Dr
- 5804 N Hills Blvd
- 3801 Pope Ave
- 31 E Lake Dr
- 3808 Pope Ave
- 3 Pine Tree Point
- 4105 N Hills Blvd
- 18 Pine Tree Loop
- 3109 Donaghey Dr
- 163 Sheridan Rd
- 322 Belmont Dr
- 3108 Cleburne Place
- 4100 Lochridge Rd
- 130 Sheridan Rd
- 36 Desoto Cir
- 1324 Skyline Dr
- 38 Desoto Cir
- 0 Shore Point
- 10 Shore Point Rd
- 12 Shore Point Rd
- 9 Shore Point Rd
- 3409 N Hills Blvd
- 13 Shore Point Rd
- 3415 N Hills Blvd
- 3405 N Hills Blvd
- 3415 N Hills Blvd
- 2 Shore Point Rd
- 3 Shore Point Rd
- 3419 N Hills Blvd
- 1 Shore Point Rd
- 8 Shore Point Rd
- 4 Shore Point Rd
- 3401 N Hills Blvd
- 3501 N Hills Blvd
- 5 Shore Point Rd
- 14 Shore Point Rd
- 3408 N Hills Blvd