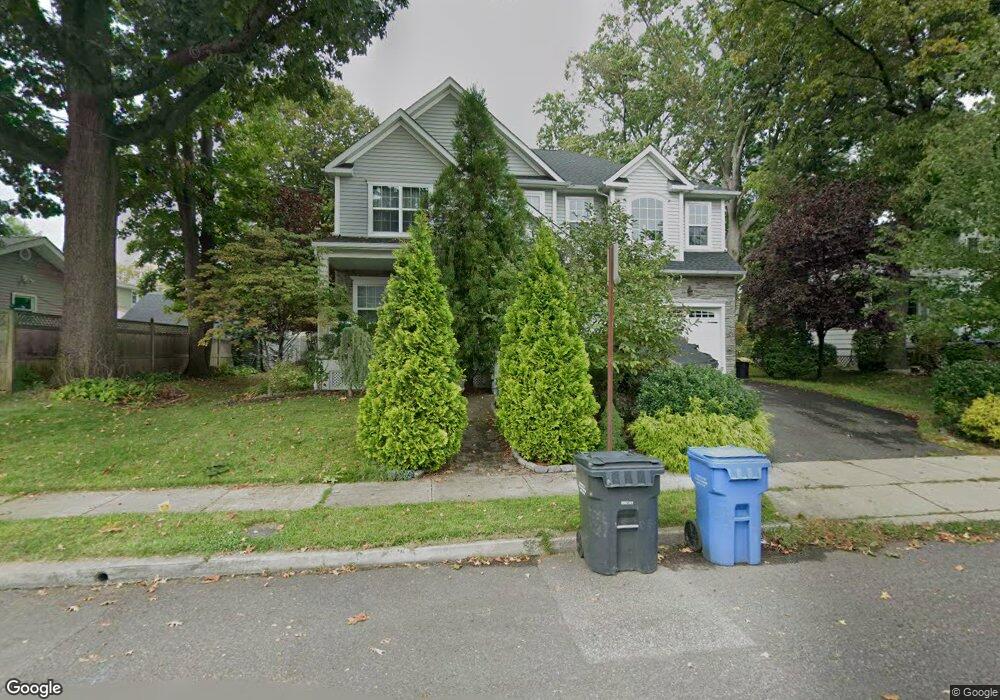
11 Sidney Place Metuchen, NJ 08840
Estimated Value: $695,000 - $1,240,000
3
Beds
1
Bath
968
Sq Ft
$1,118/Sq Ft
Est. Value
About This Home
This home is located at 11 Sidney Place, Metuchen, NJ 08840 and is currently estimated at $1,082,645, approximately $1,118 per square foot. 11 Sidney Place is a home located in Middlesex County with nearby schools including Edgar Middle School, Campbell Elementary School, and Metuchen High School.
Ownership History
Date
Name
Owned For
Owner Type
Purchase Details
Closed on
Nov 10, 2016
Sold by
Fox & Foxx Development Llc
Bought by
Tjia Robert Eugene
Current Estimated Value
Home Financials for this Owner
Home Financials are based on the most recent Mortgage that was taken out on this home.
Original Mortgage
$618,400
Outstanding Balance
$497,249
Interest Rate
3.47%
Mortgage Type
New Conventional
Estimated Equity
$585,396
Purchase Details
Closed on
Aug 10, 2015
Sold by
Cifrodelli Lawrence M and Cifrodelli Susan L
Bought by
Fox & Foxx Development Llc
Home Financials for this Owner
Home Financials are based on the most recent Mortgage that was taken out on this home.
Original Mortgage
$510,500
Interest Rate
4.07%
Mortgage Type
Construction
Purchase Details
Closed on
Aug 3, 2009
Sold by
Konick Nancy
Bought by
Cifrodelli Lawrence M and Cifrodelli Susan L
Create a Home Valuation Report for This Property
The Home Valuation Report is an in-depth analysis detailing your home's value as well as a comparison with similar homes in the area
Home Values in the Area
Average Home Value in this Area
Purchase History
| Date | Buyer | Sale Price | Title Company |
|---|---|---|---|
| Tjia Robert Eugene | -- | Associated Title | |
| Fox & Foxx Development Llc | $265,000 | None Available | |
| Cifrodelli Lawrence M | $295,000 | Fidelity Natl Title Ins Co |
Source: Public Records
Mortgage History
| Date | Status | Borrower | Loan Amount |
|---|---|---|---|
| Open | Tjia Robert Eugene | $618,400 | |
| Previous Owner | Fox & Foxx Development Llc | $510,500 |
Source: Public Records
Tax History Compared to Growth
Tax History
| Year | Tax Paid | Tax Assessment Tax Assessment Total Assessment is a certain percentage of the fair market value that is determined by local assessors to be the total taxable value of land and additions on the property. | Land | Improvement |
|---|---|---|---|---|
| 2025 | $25,038 | $360,000 | $110,000 | $250,000 |
| 2024 | $24,199 | $360,000 | $110,000 | $250,000 |
| 2023 | $24,199 | $360,000 | $110,000 | $250,000 |
| 2022 | $22,936 | $360,000 | $110,000 | $250,000 |
| 2021 | $22,410 | $360,000 | $110,000 | $250,000 |
| 2020 | $22,115 | $360,000 | $110,000 | $250,000 |
| 2019 | $21,463 | $360,000 | $110,000 | $250,000 |
| 2018 | $21,384 | $360,000 | $110,000 | $250,000 |
| 2017 | $21,316 | $360,000 | $110,000 | $250,000 |
| 2016 | $6,924 | $120,000 | $120,000 | $0 |
| 2015 | $8,130 | $144,100 | $94,700 | $49,400 |
| 2014 | $7,927 | $144,100 | $94,700 | $49,400 |
Source: Public Records
Map
Nearby Homes