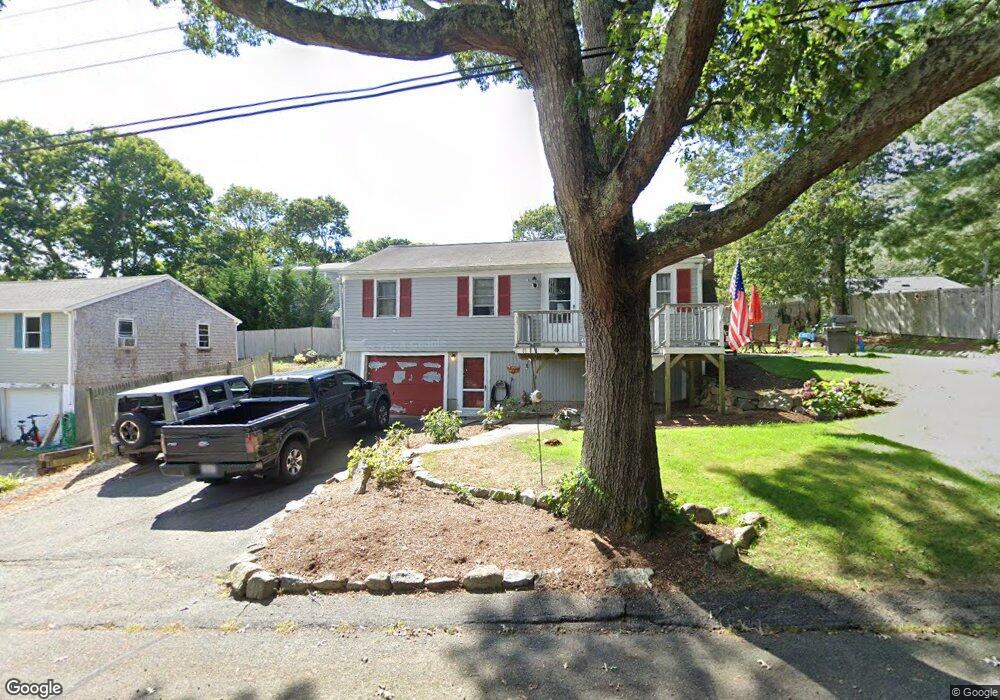
11 Signe Rd Dennis, MA 02638
Dennis Village NeighborhoodEstimated Value: $513,000 - $709,000
3
Beds
2
Baths
1,200
Sq Ft
$527/Sq Ft
Est. Value
About This Home
This home is located at 11 Signe Rd, Dennis, MA 02638 and is currently estimated at $632,428, approximately $527 per square foot. 11 Signe Rd is a home located in Barnstable County with nearby schools including Dennis-Yarmouth Regional High School.
Ownership History
Date
Name
Owned For
Owner Type
Purchase Details
Closed on
Aug 24, 2005
Sold by
Stanley Dean F and Stanley Eric
Bought by
Williams Lesley S and Williams Rickey
Current Estimated Value
Home Financials for this Owner
Home Financials are based on the most recent Mortgage that was taken out on this home.
Original Mortgage
$232,000
Outstanding Balance
$122,029
Interest Rate
5.68%
Mortgage Type
Purchase Money Mortgage
Estimated Equity
$510,399
Purchase Details
Closed on
Jul 9, 2004
Sold by
Jorgensen Lisa and Jorgensen Tracy
Bought by
Stanley Dean F and Stanley Eric
Home Financials for this Owner
Home Financials are based on the most recent Mortgage that was taken out on this home.
Original Mortgage
$249,690
Interest Rate
6.32%
Mortgage Type
Purchase Money Mortgage
Create a Home Valuation Report for This Property
The Home Valuation Report is an in-depth analysis detailing your home's value as well as a comparison with similar homes in the area
Home Values in the Area
Average Home Value in this Area
Purchase History
| Date | Buyer | Sale Price | Title Company |
|---|---|---|---|
| Williams Lesley S | $290,000 | -- | |
| Stanley Dean F | $259,000 | -- |
Source: Public Records
Mortgage History
| Date | Status | Borrower | Loan Amount |
|---|---|---|---|
| Open | Williams Lesley S | $232,000 | |
| Previous Owner | Stanley Dean F | $249,690 |
Source: Public Records
Tax History
| Year | Tax Paid | Tax Assessment Tax Assessment Total Assessment is a certain percentage of the fair market value that is determined by local assessors to be the total taxable value of land and additions on the property. | Land | Improvement |
|---|---|---|---|---|
| 2025 | $2,437 | $562,900 | $184,500 | $378,400 |
| 2024 | $2,342 | $533,400 | $177,500 | $355,900 |
| 2023 | $2,149 | $460,100 | $136,500 | $323,600 |
| 2022 | $2,028 | $362,100 | $123,000 | $239,100 |
| 2021 | $1,936 | $321,000 | $120,600 | $200,400 |
| 2020 | $1,912 | $313,400 | $131,500 | $181,900 |
| 2019 | $1,992 | $322,800 | $161,200 | $161,600 |
| 2018 | $1,710 | $269,700 | $122,800 | $146,900 |
| 2017 | $1,629 | $264,900 | $122,800 | $142,100 |
| 2016 | $1,596 | $244,400 | $122,800 | $121,600 |
| 2015 | $1,564 | $244,400 | $122,800 | $121,600 |
| 2014 | $1,422 | $223,900 | $102,300 | $121,600 |
Source: Public Records
Map
Nearby Homes
- 59 Main St Unit 19-2
- 59 Route 6a Unit 29-4
- 26 S West Dr
- 59 Massachusetts 6a Unit 19-2
- 568 Route 6a
- 268 Main St
- 20 Bray Farm Rd S
- 15 Musket Ln
- 6 Thomas Ct
- 64 Kates Path
- 54 Kates Path Unit 54
- 15 Signal Hill Dr
- 100 Kates Path Unit 100
- 52 Uncle Bobs Way
- 15 John Hall Cartway Unit 15
- 35 Crown Grant Dr
- 228 Kates Path
- 93 Stratford Ln
- 32 Captain Walsh Dr
- 930 Old Bass River Rd
Your Personal Tour Guide
Ask me questions while you tour the home.