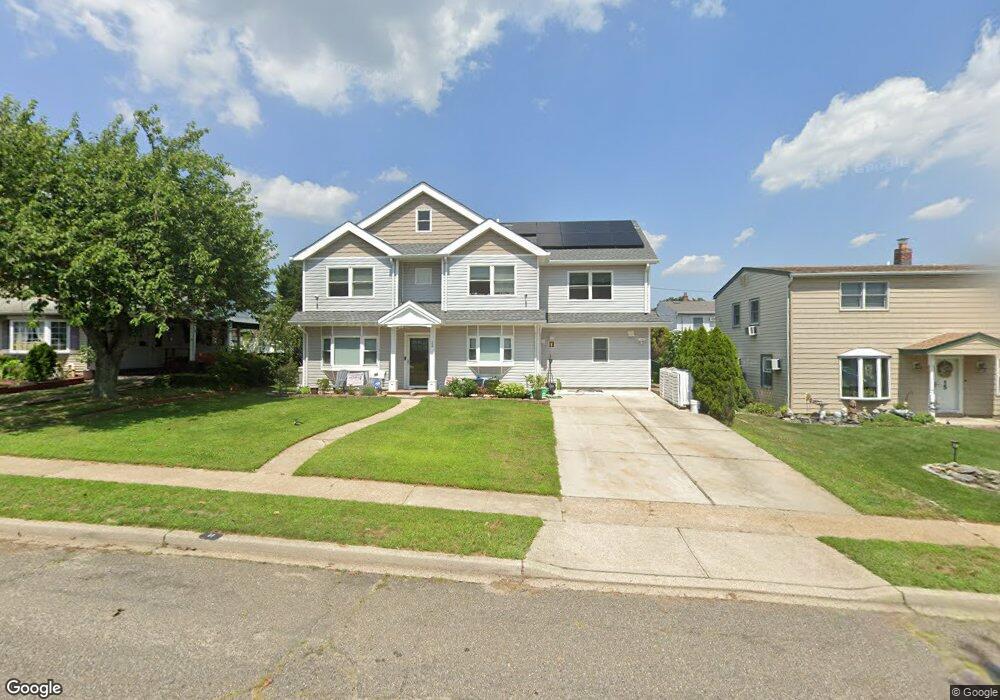
11 Silo Ln Levittown, NY 11756
Estimated Value: $710,000 - $870,918
4
Beds
2
Baths
1,500
Sq Ft
$527/Sq Ft
Est. Value
About This Home
This home is located at 11 Silo Ln, Levittown, NY 11756 and is currently estimated at $790,459, approximately $526 per square foot. 11 Silo Ln is a home located in Nassau County with nearby schools including Gardiners Avenue School, Jonas E. Salk Middle School, and Gen. Douglas MacArthur Senior High School.
Ownership History
Date
Name
Owned For
Owner Type
Purchase Details
Closed on
Aug 24, 2016
Sold by
Carswell James W
Bought by
Wong Lap Yan and Lai Juesan
Current Estimated Value
Home Financials for this Owner
Home Financials are based on the most recent Mortgage that was taken out on this home.
Original Mortgage
$240,000
Outstanding Balance
$191,492
Interest Rate
3.48%
Mortgage Type
New Conventional
Estimated Equity
$598,967
Create a Home Valuation Report for This Property
The Home Valuation Report is an in-depth analysis detailing your home's value as well as a comparison with similar homes in the area
Home Values in the Area
Average Home Value in this Area
Purchase History
| Date | Buyer | Sale Price | Title Company |
|---|---|---|---|
| Wong Lap Yan | -- | Vintage Title Agency |
Source: Public Records
Mortgage History
| Date | Status | Borrower | Loan Amount |
|---|---|---|---|
| Open | Wong Lap Yan | $240,000 |
Source: Public Records
Tax History Compared to Growth
Tax History
| Year | Tax Paid | Tax Assessment Tax Assessment Total Assessment is a certain percentage of the fair market value that is determined by local assessors to be the total taxable value of land and additions on the property. | Land | Improvement |
|---|---|---|---|---|
| 2025 | $14,166 | $570 | $215 | $355 |
| 2024 | $3,541 | $440 | $221 | $219 |
| 2023 | $13,168 | $423 | $217 | $206 |
| 2022 | $13,168 | $431 | $221 | $210 |
| 2021 | $18,574 | $410 | $210 | $200 |
| 2020 | $13,422 | $625 | $467 | $158 |
| 2019 | $13,159 | $739 | $552 | $187 |
| 2018 | $15,518 | $739 | $0 | $0 |
| 2017 | $7,714 | $739 | $552 | $187 |
| 2016 | $11,273 | $739 | $552 | $187 |
| 2015 | $3,260 | $739 | $552 | $187 |
| 2014 | $3,260 | $739 | $552 | $187 |
| 2013 | $2,994 | $739 | $552 | $187 |
Source: Public Records
Map
Nearby Homes