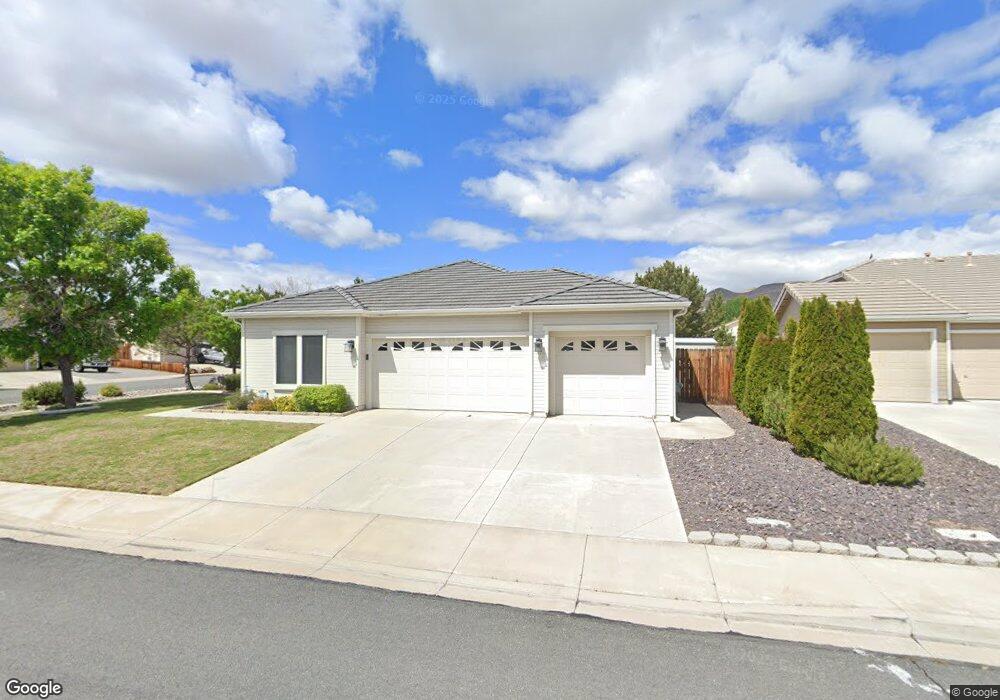
11 Silver Springs Ct Sparks, NV 89436
Eagle Canyon-Pebble Creek NeighborhoodEstimated Value: $541,000 - $568,000
3
Beds
2
Baths
1,597
Sq Ft
$346/Sq Ft
Est. Value
About This Home
This home is located at 11 Silver Springs Ct, Sparks, NV 89436 and is currently estimated at $553,005, approximately $346 per square foot. 11 Silver Springs Ct is a home located in Washoe County with nearby schools including Jesse Hall Elementery School, Yvonne Shaw Middle School, and Spanish Springs High School.
Ownership History
Date
Name
Owned For
Owner Type
Purchase Details
Closed on
Nov 29, 2010
Sold by
Rose Anthony Leroy and Rose Sharon Jean
Bought by
2010 Rose Family Trust
Current Estimated Value
Purchase Details
Closed on
Nov 12, 2008
Sold by
Rose Anthony L and Rose Sharon J
Bought by
Rose Anthony L and Rose Sharon J
Purchase Details
Closed on
May 17, 2007
Sold by
Rose Anthony L
Bought by
Rose Anthony L and Rose Sharon J
Purchase Details
Closed on
Oct 26, 2005
Sold by
Grooms Randall A and Grooms Linda S
Bought by
Rose Anthony L
Purchase Details
Closed on
Mar 28, 2002
Sold by
Cimarron West Llc
Bought by
Grooms Randall A and Grooms Linda S
Home Financials for this Owner
Home Financials are based on the most recent Mortgage that was taken out on this home.
Original Mortgage
$182,319
Interest Rate
6.84%
Mortgage Type
VA
Create a Home Valuation Report for This Property
The Home Valuation Report is an in-depth analysis detailing your home's value as well as a comparison with similar homes in the area
Home Values in the Area
Average Home Value in this Area
Purchase History
| Date | Buyer | Sale Price | Title Company |
|---|---|---|---|
| 2010 Rose Family Trust | -- | None Available | |
| Rose Anthony Leroy | -- | None Available | |
| Rose Anthony L | -- | None Available | |
| Rose Anthony L | -- | None Available | |
| Rose Anthony L | $390,000 | Stewart Title Of Northern Nv | |
| Grooms Randall A | $182,319 | First American Title |
Source: Public Records
Mortgage History
| Date | Status | Borrower | Loan Amount |
|---|---|---|---|
| Previous Owner | Grooms Randall A | $182,319 |
Source: Public Records
Tax History Compared to Growth
Tax History
| Year | Tax Paid | Tax Assessment Tax Assessment Total Assessment is a certain percentage of the fair market value that is determined by local assessors to be the total taxable value of land and additions on the property. | Land | Improvement |
|---|---|---|---|---|
| 2025 | -- | $116,873 | $37,835 | $79,038 |
| 2024 | -- | $114,170 | $34,580 | $79,590 |
| 2023 | $2,294 | $110,696 | $35,385 | $75,311 |
| 2022 | $0 | $91,131 | $28,700 | $62,431 |
| 2021 | $2,215 | $86,383 | $23,940 | $62,443 |
| 2020 | $2,102 | $86,159 | $23,555 | $62,604 |
| 2019 | $2,044 | $83,266 | $23,590 | $59,676 |
| 2018 | $2,029 | $74,068 | $15,750 | $58,318 |
| 2017 | $1,929 | $74,115 | $15,750 | $58,365 |
| 2016 | $1,924 | $73,092 | $13,440 | $59,652 |
| 2015 | $487 | $72,900 | $13,370 | $59,530 |
| 2014 | $1,861 | $66,922 | $9,380 | $57,542 |
| 2013 | -- | $55,497 | $7,350 | $48,147 |
Source: Public Records
Map
Nearby Homes
- 256 Tankersley Dr
- 160 Ember Dr
- 170 Veronica Ave
- 30 Horse Springs Dr
- 20 Tankersley Ct
- 195 Monumental Cir
- 195 Mia Dr
- 2755 Falcon View Ct
- 15 N Patterson Place
- 335 Veronica Ave
- 30 N Patterson Place
- 35 N Tropicana Cir
- 42 S Amanda Cir
- 50 N Spring Mountain Cir
- 284 Arlis Place
- 282 Arlis Place
- The Vineyard Plan at Silverado Village
- The Nantucket Plan at Silverado Village
- The Newport Plan at Silverado Village
- The Cape Plan at Silverado Village
- 17 Silver Springs Ct
- 12 Sharp Springs Ct
- 232 Tankersley Dr
- 238 Tankersley Dr
- 12 Silver Springs Ct
- 18 Sharp Springs Ct
- 23 Silver Springs Ct
- 226 Tankersley Dr
- 244 Tankersley Dr
- 29 Silver Springs Ct
- 18 Silver Springs Ct
- 24 Sharp Springs Ct
- 220 Tankersley Dr
- 250 Tankersley Dr
- 30 Silver Springs Ct
- 243 Bartmess Blvd
- 216 Tankersley Dr
- 247 Bartmess Blvd
- 235 Bartmess Blvd
- 30 Sharp Springs Ct