Estimated Value: $656,000 - $761,000
3
Beds
2
Baths
1,768
Sq Ft
$398/Sq Ft
Est. Value
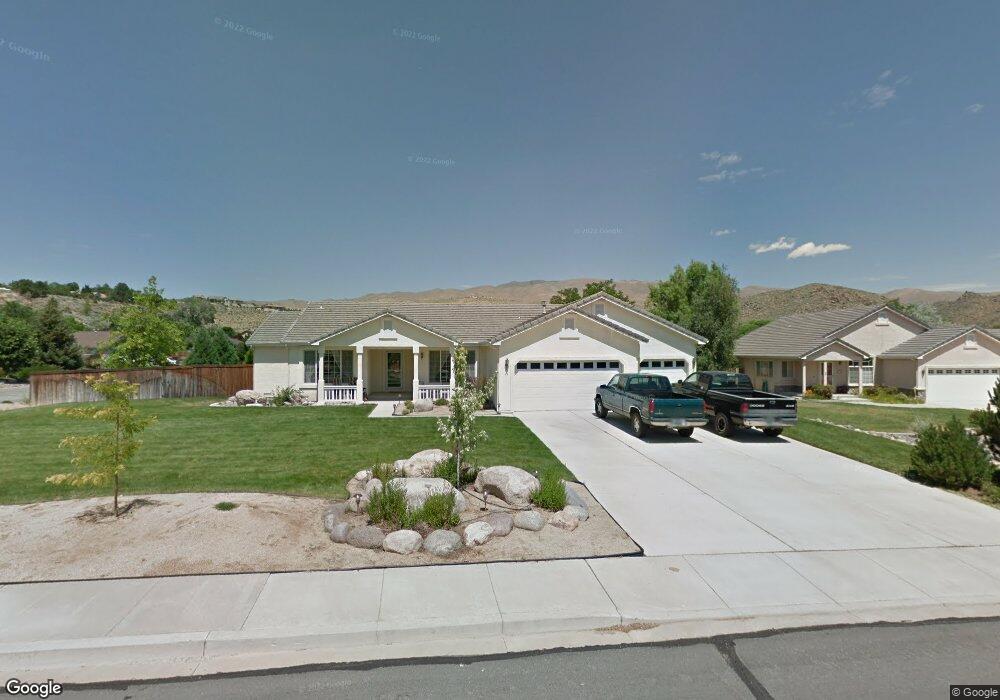
About This Home
This home is located at 11 Silver State Ct, Reno, NV 89523 and is currently estimated at $702,959, approximately $397 per square foot. 11 Silver State Ct is a home located in Washoe County with nearby schools including Verdi Elementary School, B D Billinghurst Middle School, and Robert McQueen High School.
Ownership History
Date
Name
Owned For
Owner Type
Purchase Details
Closed on
Oct 15, 2015
Sold by
Mallard Properties Llc
Bought by
Post Andrew F and Brassington Post Liz
Current Estimated Value
Home Financials for this Owner
Home Financials are based on the most recent Mortgage that was taken out on this home.
Original Mortgage
$246,489
Interest Rate
4.4%
Mortgage Type
FHA
Purchase Details
Closed on
May 21, 2015
Sold by
Pointer Gerald M and Pointer Jacqueline A
Bought by
Mallard Properties Llc
Purchase Details
Closed on
Nov 23, 1998
Sold by
M B Construction Co Inc
Bought by
Pointer Gerald M and Pointer Jacqueline A
Home Financials for this Owner
Home Financials are based on the most recent Mortgage that was taken out on this home.
Original Mortgage
$151,800
Interest Rate
6.42%
Purchase Details
Closed on
Oct 8, 1998
Sold by
Builders Association Of Northern Nevada
Bought by
M B Construction Co Inc
Home Financials for this Owner
Home Financials are based on the most recent Mortgage that was taken out on this home.
Original Mortgage
$151,800
Interest Rate
6.42%
Create a Home Valuation Report for This Property
The Home Valuation Report is an in-depth analysis detailing your home's value as well as a comparison with similar homes in the area
Home Values in the Area
Average Home Value in this Area
Purchase History
| Date | Buyer | Sale Price | Title Company |
|---|---|---|---|
| Post Andrew F | $285,000 | Western Title Co | |
| Mallard Properties Llc | $230,000 | Western Title Co | |
| Pointer Gerald M | $213,000 | Founders Title Co | |
| M B Construction Co Inc | $55,000 | Founders Title Co |
Source: Public Records
Mortgage History
| Date | Status | Borrower | Loan Amount |
|---|---|---|---|
| Previous Owner | Post Andrew F | $246,489 | |
| Previous Owner | Pointer Gerald M | $151,800 | |
| Previous Owner | M B Construction Co Inc | $125,000 |
Source: Public Records
Tax History
| Year | Tax Paid | Tax Assessment Tax Assessment Total Assessment is a certain percentage of the fair market value that is determined by local assessors to be the total taxable value of land and additions on the property. | Land | Improvement |
|---|---|---|---|---|
| 2026 | $2,340 | $136,466 | $59,682 | $76,784 |
| 2024 | $3,054 | $136,183 | $56,963 | $79,220 |
| 2023 | $2,966 | $130,252 | $55,309 | $74,944 |
| 2022 | $2,880 | $107,764 | $45,239 | $62,525 |
| 2021 | $2,798 | $96,387 | $33,884 | $62,503 |
| 2020 | $2,715 | $95,701 | $33,075 | $62,626 |
| 2019 | $2,637 | $90,524 | $30,503 | $60,021 |
| 2018 | $2,555 | $83,406 | $24,623 | $58,783 |
| 2017 | $2,475 | $78,191 | $19,173 | $59,018 |
| 2016 | $2,407 | $81,187 | $18,596 | $62,591 |
| 2015 | -- | $75,303 | $16,709 | $58,594 |
| 2014 | $2,269 | $73,753 | $17,094 | $56,659 |
| 2013 | -- | $67,381 | $11,585 | $55,796 |
Source: Public Records
Map
Nearby Homes
- 40 Eagle Claw Ct
- 65 Nightowl Dr
- 0 Cliff View Dr
- 280 Eucalyptus Ct
- 80 Bobcat Dr
- 415 Gooseberry Dr
- 0 Mountain Haven Ln
- 1660 Boulder Ridge Ct
- 865 Larrimore Trail
- 845 Larrimore Trail
- 1068 Callaway Trail
- 1150 Cliff Park Way
- 9225 Sassafras Trail
- 8726 Larkhaven Ct
- 1050 Udowski Ct
- 1075 Udowski Ct
- 8778 Larkhaven Trail
- 1140 Sugar Creek Trail
- 1539 Elk Run Trail
- 1240 Cliff Park Way
- 15 Silver State Ct
- 12 Silver State Ct
- 10 Goshawk Ct
- 15 Eagle Claw Ct
- 14 Silver State Ct
- 20 Goshawk Ct
- 875 Cliff View Dr
- 17 Silver State Ct
- 0 Silver Horse Rd
- 25 Eagle Claw Ct
- 19 Silver State Ct
- 16 Silver State Ct
- 870 Cliff View Dr
- 25 Goshawk Ct
- 000 Eagle Ridge Ct
- 0000 Eagle Ridge Ct
- 0 Eagle Ridge Ct
- 30 Goshawk Ct
- 10310 Mountain Dew Cir
- 10 Eagle Claw Ct
Your Personal Tour Guide
Ask me questions while you tour the home.