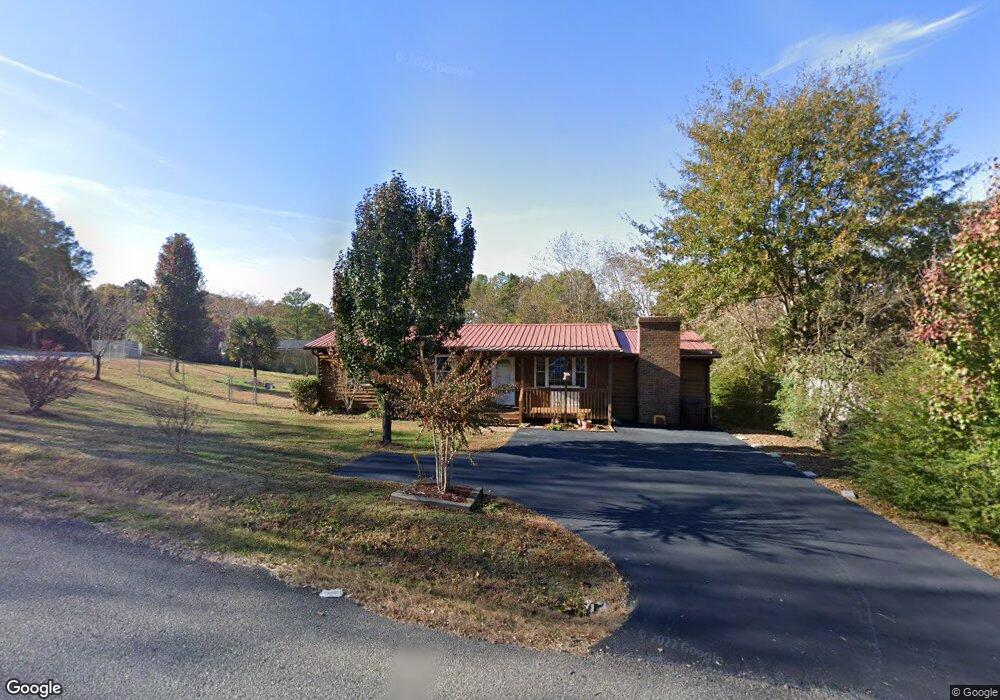
11 Sioux Rd NE Cartersville, GA 30121
Estimated Value: $219,000 - $253,000
3
Beds
1
Bath
1,248
Sq Ft
$190/Sq Ft
Est. Value
About This Home
This home is located at 11 Sioux Rd NE, Cartersville, GA 30121 and is currently estimated at $237,055, approximately $189 per square foot. 11 Sioux Rd NE is a home located in Bartow County with nearby schools including White Elementary School, Cass Middle School, and Cass High School.
Ownership History
Date
Name
Owned For
Owner Type
Purchase Details
Closed on
Sep 30, 2019
Sold by
Cousar James M
Bought by
Lamb Steve and Nething Melody S
Current Estimated Value
Home Financials for this Owner
Home Financials are based on the most recent Mortgage that was taken out on this home.
Original Mortgage
$85,000
Outstanding Balance
$74,464
Interest Rate
3.5%
Mortgage Type
New Conventional
Estimated Equity
$162,591
Purchase Details
Closed on
Mar 28, 2008
Sold by
Us Bank National Associati
Bought by
Cousar James M
Purchase Details
Closed on
Aug 7, 2007
Sold by
Abernathy Timothy Shane
Bought by
Us Bank National Association
Purchase Details
Closed on
May 12, 2005
Sold by
Abernathy Vickie
Bought by
Abernathy Timothy Shane
Home Financials for this Owner
Home Financials are based on the most recent Mortgage that was taken out on this home.
Original Mortgage
$80,000
Interest Rate
5.8%
Mortgage Type
New Conventional
Create a Home Valuation Report for This Property
The Home Valuation Report is an in-depth analysis detailing your home's value as well as a comparison with similar homes in the area
Home Values in the Area
Average Home Value in this Area
Purchase History
| Date | Buyer | Sale Price | Title Company |
|---|---|---|---|
| Lamb Steve | $115,000 | -- | |
| Cousar James M | $43,000 | -- | |
| Us Bank National Association | $80,000 | -- | |
| Abernathy Timothy Shane | $100,000 | -- |
Source: Public Records
Mortgage History
| Date | Status | Borrower | Loan Amount |
|---|---|---|---|
| Open | Lamb Steve | $85,000 | |
| Previous Owner | Abernathy Timothy Shane | $80,000 | |
| Previous Owner | Abernathy Timothy Shane | $20,000 |
Source: Public Records
Tax History Compared to Growth
Tax History
| Year | Tax Paid | Tax Assessment Tax Assessment Total Assessment is a certain percentage of the fair market value that is determined by local assessors to be the total taxable value of land and additions on the property. | Land | Improvement |
|---|---|---|---|---|
| 2024 | $1,562 | $77,715 | $19,600 | $58,115 |
| 2023 | $1,733 | $81,622 | $19,600 | $62,022 |
| 2022 | $2,067 | $81,426 | $16,000 | $65,426 |
| 2021 | $1,352 | $50,669 | $14,000 | $36,669 |
| 2020 | $1,264 | $46,801 | $14,000 | $32,801 |
| 2019 | $221 | $29,582 | $12,000 | $17,582 |
| 2018 | $179 | $24,874 | $8,000 | $16,874 |
| 2017 | $179 | $24,874 | $8,000 | $16,874 |
| 2016 | $167 | $23,520 | $6,000 | $17,520 |
| 2015 | $167 | $23,520 | $6,000 | $17,520 |
| 2014 | -- | $16,200 | $5,200 | $11,000 |
| 2013 | -- | $15,080 | $5,200 | $9,880 |
Source: Public Records
Map
Nearby Homes
- 92 Vaughn Spur NE
- 141 Vaughn Spur NE
- 15 Plantation Dr NE
- 21 Chestnut Ridge Dr NE
- 0 Lewis Rd NW Unit 10573789
- 17 Ridgeline Way NW
- 25 Running Terrace Way
- 26 Brookside Way NW
- 31 Brookside Way NW
- 37 Brookside Way NW
- 999 Grassdale Rd NW
- 15 Parkside View
- 941 Grassdale Rd NW
- 75 Willow Bend Dr NW
- 102 Potters Field NW
- 1011 Cassville White Rd
- 30 Saddle Ln NW
- 18 Mary Ln NE
- 107 Wins Walk NW
- 111 Weston Way NW
- 11 Sioux Rd NE
- 17 Sioux Rd NE
- 18 Seminole Rd NE
- 16 16 Seminole Rd
- 16 Seminole Rd NE
- 28 Seminole Rd NE
- 28 Seminole Rd NE
- 21 Habersham Cir NE
- 19 Sioux Rd NE
- 25 Habersham Cir NE
- 30 Seminole Rd NE
- 15 Habersham Cir NE
- 14 Sioux Rd NE
- 27 Habersham Cir NE
- 21 Sioux Rd NE
- 22 Sioux Rd NE
- 34 Seminole Rd NE
- 21 Seminole Rd NE
- 13 Habersham Cir NE Unit 13
- 13 Habersham Cir NE