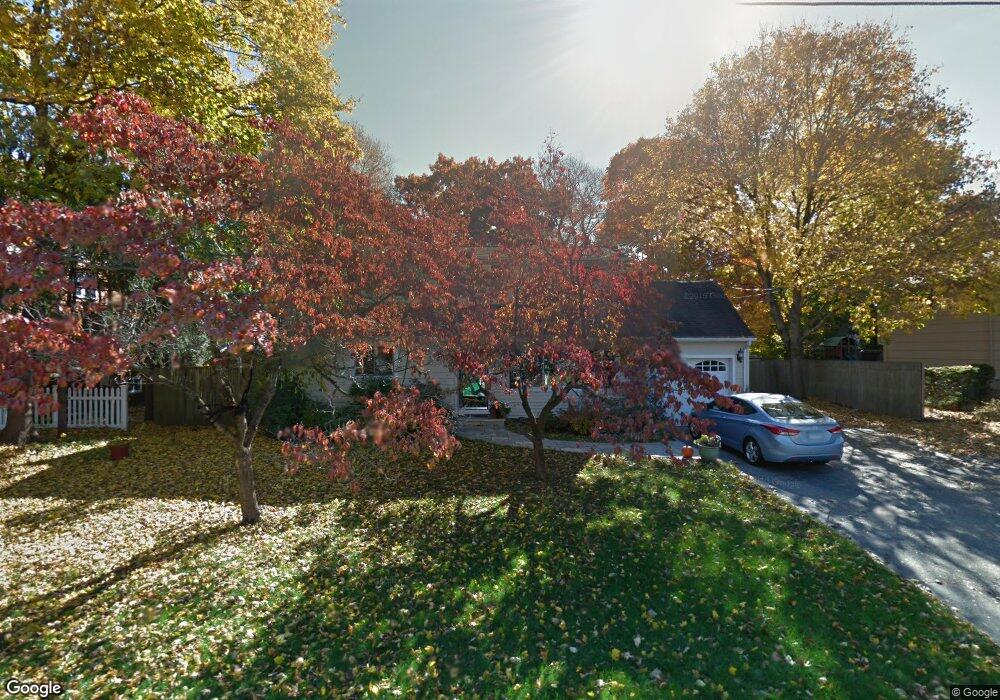
11 Sniffen Rd Westport, CT 06880
Westport Village NeighborhoodEstimated Value: $1,091,000 - $1,409,000
4
Beds
3
Baths
1,642
Sq Ft
$746/Sq Ft
Est. Value
About This Home
This home is located at 11 Sniffen Rd, Westport, CT 06880 and is currently estimated at $1,225,278, approximately $746 per square foot. 11 Sniffen Rd is a home located in Fairfield County with nearby schools including Coleytown Elementary School, Coleytown Middle School, and Staples High School.
Ownership History
Date
Name
Owned For
Owner Type
Purchase Details
Closed on
Sep 15, 2021
Sold by
Gordon William E and Gordon Kristine R
Bought by
Zhang Xia and Li Haifeng
Current Estimated Value
Home Financials for this Owner
Home Financials are based on the most recent Mortgage that was taken out on this home.
Original Mortgage
$631,960
Outstanding Balance
$574,178
Interest Rate
2.7%
Mortgage Type
Purchase Money Mortgage
Estimated Equity
$651,100
Purchase Details
Closed on
Sep 5, 2006
Sold by
Somol Walter C and Somol Paige K
Bought by
Gordon William E and Gordon Kristine R
Home Financials for this Owner
Home Financials are based on the most recent Mortgage that was taken out on this home.
Original Mortgage
$600,000
Interest Rate
6.37%
Purchase Details
Closed on
Sep 19, 2005
Sold by
Bass Michael S and Bass Pamela C
Bought by
Somol Walter C and Somol Paige K
Purchase Details
Closed on
Sep 14, 2001
Sold by
Antinozzi Marian
Bought by
Bass Michael and Bass Pam
Create a Home Valuation Report for This Property
The Home Valuation Report is an in-depth analysis detailing your home's value as well as a comparison with similar homes in the area
Home Values in the Area
Average Home Value in this Area
Purchase History
| Date | Buyer | Sale Price | Title Company |
|---|---|---|---|
| Zhang Xia | $789,950 | None Available | |
| Zhang Xia | $789,950 | None Available | |
| Gordon William E | $750,000 | -- | |
| Gordon William E | $750,000 | -- | |
| Somol Walter C | $799,000 | -- | |
| Somol Walter C | $799,000 | -- | |
| Bass Michael | $527,000 | -- | |
| Bass Michael | $527,000 | -- |
Source: Public Records
Mortgage History
| Date | Status | Borrower | Loan Amount |
|---|---|---|---|
| Open | Zhang Xia | $631,960 | |
| Closed | Zhang Xia | $631,960 | |
| Previous Owner | Bass Michael | $600,000 | |
| Previous Owner | Bass Michael | $75,000 |
Source: Public Records
Tax History Compared to Growth
Tax History
| Year | Tax Paid | Tax Assessment Tax Assessment Total Assessment is a certain percentage of the fair market value that is determined by local assessors to be the total taxable value of land and additions on the property. | Land | Improvement |
|---|---|---|---|---|
| 2025 | $8,602 | $456,100 | $280,400 | $175,700 |
| 2024 | $8,493 | $456,100 | $280,400 | $175,700 |
| 2023 | $8,369 | $456,100 | $280,400 | $175,700 |
| 2022 | $8,242 | $456,100 | $280,400 | $175,700 |
| 2021 | $8,242 | $456,100 | $280,400 | $175,700 |
| 2020 | $7,516 | $478,700 | $282,900 | $195,800 |
| 2019 | $8,071 | $478,700 | $282,900 | $195,800 |
| 2018 | $8,071 | $478,700 | $282,900 | $195,800 |
| 2017 | $8,071 | $478,700 | $282,900 | $195,800 |
| 2016 | $8,071 | $478,700 | $282,900 | $195,800 |
| 2015 | $7,227 | $399,500 | $227,600 | $171,900 |
| 2014 | $7,167 | $399,500 | $227,600 | $171,900 |
Source: Public Records
Map
Nearby Homes
- 489 Main St
- 3 Ln
- 15 Cross Hwy
- 41 Richmondville Ave Unit 104
- 41 Richmondville Ave Unit Duplex 2
- 41 Richmondville Ave Unit 303
- 41 Richmondville Ave Unit 111
- 41 Richmondville Ave Unit 101
- 41 Richmondville Ave Unit 105
- 10 Twin Falls Ln
- 53 Cross Hwy
- 259 Wilton Rd
- 3 Hickory Hill Rd
- 87 Red Coat Rd
- 7 Wild Rose Rd
- 26 Hitchcock Rd
- 310 Main St
- 21 Warnock Dr
- 30 Cavalry Rd
- 113 Kings Hwy N