Estimated Value: $920,703 - $1,407,000
3
Beds
2
Baths
1,800
Sq Ft
$609/Sq Ft
Est. Value
About This Home
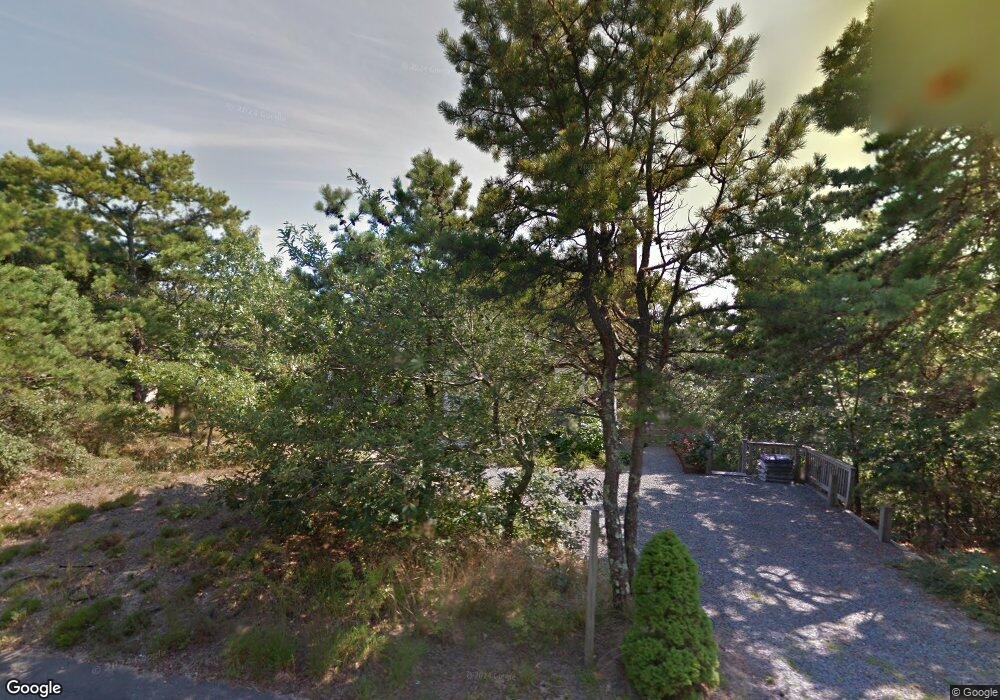
This home is located at 11 Snows Rd, Truro, MA 2666 and is currently estimated at $1,096,176, approximately $608 per square foot. 11 Snows Rd is a home located in Barnstable County with nearby schools including Truro Central School.
Ownership History
Date
Name
Owned For
Owner Type
Purchase Details
Closed on
Nov 12, 2004
Sold by
Mclaughlin Richard C
Bought by
Hebert Aline M and Mclaughlin George F
Current Estimated Value
Purchase Details
Closed on
Jun 22, 2000
Sold by
Maynard Keith
Bought by
Mclaughlin Richard C
Purchase Details
Closed on
Apr 14, 1999
Sold by
Thompson Jerome B and Thompson Porter B
Bought by
Maynard Keith
Purchase Details
Closed on
Nov 24, 1997
Sold by
Rainbow Rt and Sweet Valerie
Bought by
Thompson Jerome B and Thompson Porter B
Create a Home Valuation Report for This Property
The Home Valuation Report is an in-depth analysis detailing your home's value as well as a comparison with similar homes in the area
Home Values in the Area
Average Home Value in this Area
Purchase History
| Date | Buyer | Sale Price | Title Company |
|---|---|---|---|
| Hebert Aline M | $570,000 | -- | |
| Mclaughlin Richard C | $270,000 | -- | |
| Maynard Keith | $253,000 | -- | |
| Thompson Jerome B | $65,000 | -- |
Source: Public Records
Mortgage History
| Date | Status | Borrower | Loan Amount |
|---|---|---|---|
| Open | Thompson Jerome B | $452,000 | |
| Closed | Thompson Jerome B | $462,500 |
Source: Public Records
Tax History
| Year | Tax Paid | Tax Assessment Tax Assessment Total Assessment is a certain percentage of the fair market value that is determined by local assessors to be the total taxable value of land and additions on the property. | Land | Improvement |
|---|---|---|---|---|
| 2025 | $4,727 | $764,900 | $256,600 | $508,300 |
| 2024 | $4,462 | $744,900 | $254,100 | $490,800 |
| 2023 | $4,215 | $644,500 | $220,900 | $423,600 |
| 2022 | $3,918 | $506,800 | $190,400 | $316,400 |
| 2021 | $3,513 | $476,000 | $190,400 | $285,600 |
| 2020 | $3,480 | $474,800 | $188,500 | $286,300 |
| 2019 | $3,443 | $462,200 | $188,500 | $273,700 |
| 2018 | $3,240 | $439,600 | $188,500 | $251,100 |
| 2017 | $2,990 | $428,300 | $188,500 | $239,800 |
| 2016 | $2,877 | $424,900 | $186,700 | $238,200 |
| 2015 | $2,763 | $416,800 | $184,900 | $231,900 |
Source: Public Records
Map
Nearby Homes
- 63 Old Kings Hwy
- 57 Old Kings Hwy
- 3 N Union Field Rd
- 34 Truro Center Rd
- 2 Meetinghouse Rd Unit 2
- 4 Resolution Rd
- 2 Aldrich Rd
- 2 Resolution Rd
- 25 Resolution Rd
- 32 Depot Rd
- 7 Great Hollow Rd Unit 50
- 7 Great Hollow Rd Unit 50
- 46 S Pamet Rd
- 19 Old Bridge Rd
- 52 Corn Hill Rd
- 3 Bayberry Rd
- 7 Fishermans Rd
- 4 S Highland Rd Unit C
- 27 Fishermans Rd
- 23 Crestview Cir
Your Personal Tour Guide
Ask me questions while you tour the home.