Estimated Value: $276,615 - $292,000
3
Beds
2
Baths
1,546
Sq Ft
$183/Sq Ft
Est. Value
About This Home
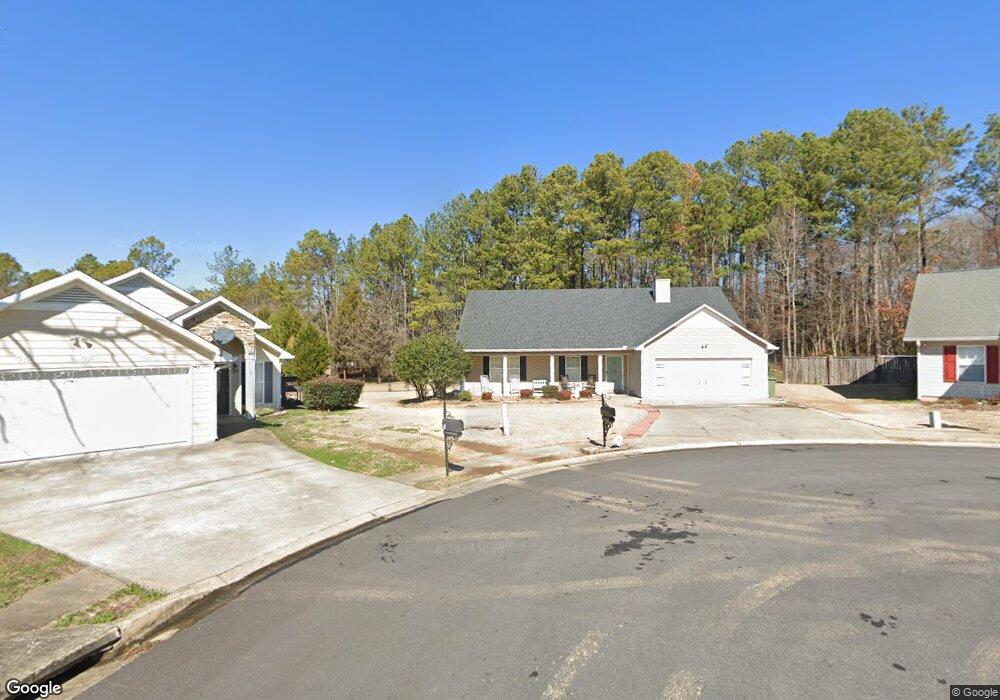
This home is located at 11 Split Branch Ct NE, Rome, GA 30165 and is currently estimated at $283,154, approximately $183 per square foot. 11 Split Branch Ct NE is a home located in Floyd County with nearby schools including Armuchee Middle School, Armuchee High School, and Unity Christian School.
Ownership History
Date
Name
Owned For
Owner Type
Purchase Details
Closed on
Sep 23, 2011
Sold by
Lewis Melinda A
Bought by
Johns Patches
Current Estimated Value
Home Financials for this Owner
Home Financials are based on the most recent Mortgage that was taken out on this home.
Original Mortgage
$115,266
Outstanding Balance
$79,084
Interest Rate
4.3%
Mortgage Type
FHA
Estimated Equity
$204,070
Purchase Details
Closed on
May 30, 2008
Sold by
Not Provided
Bought by
Lewis Melinda A
Home Financials for this Owner
Home Financials are based on the most recent Mortgage that was taken out on this home.
Original Mortgage
$143,744
Interest Rate
6.02%
Mortgage Type
FHA
Purchase Details
Closed on
May 10, 2004
Sold by
A W Landscape Construction Inc
Bought by
Taylor Andrew
Purchase Details
Closed on
May 19, 2003
Sold by
27 East Llc
Bought by
A W Landscape Construction Inc
Purchase Details
Closed on
Apr 23, 1998
Bought by
27 East Llc
Create a Home Valuation Report for This Property
The Home Valuation Report is an in-depth analysis detailing your home's value as well as a comparison with similar homes in the area
Home Values in the Area
Average Home Value in this Area
Purchase History
| Date | Buyer | Sale Price | Title Company |
|---|---|---|---|
| Johns Patches | $125,000 | -- | |
| Lewis Melinda A | $146,000 | -- | |
| Lewis Melinda A | $146,000 | -- | |
| Taylor Andrew | $132,000 | -- | |
| A W Landscape Construction Inc | $23,000 | -- | |
| 27 East Llc | -- | -- |
Source: Public Records
Mortgage History
| Date | Status | Borrower | Loan Amount |
|---|---|---|---|
| Open | Johns Patches | $115,266 | |
| Previous Owner | Lewis Melinda A | $143,744 |
Source: Public Records
Tax History Compared to Growth
Tax History
| Year | Tax Paid | Tax Assessment Tax Assessment Total Assessment is a certain percentage of the fair market value that is determined by local assessors to be the total taxable value of land and additions on the property. | Land | Improvement |
|---|---|---|---|---|
| 2024 | $2,391 | $112,980 | $10,080 | $102,900 |
| 2023 | $2,410 | $99,146 | $10,080 | $89,066 |
| 2022 | $2,008 | $84,948 | $9,600 | $75,348 |
| 2021 | $1,710 | $66,882 | $9,600 | $57,282 |
| 2020 | $1,631 | $61,970 | $9,600 | $52,370 |
| 2019 | $1,568 | $59,556 | $9,600 | $49,956 |
| 2018 | $1,485 | $54,876 | $9,600 | $45,276 |
| 2017 | $1,398 | $49,970 | $9,600 | $40,370 |
| 2016 | $1,347 | $46,559 | $9,600 | $36,959 |
| 2015 | $1,320 | $46,559 | $9,600 | $36,959 |
| 2014 | $1,320 | $46,559 | $9,600 | $36,959 |
Source: Public Records
Map
Nearby Homes
- 9 Redfern Trail NE
- 4 Glen View Dr NE
- 3158 Martha Berry Hwy
- 8 Coggins Place NE
- 631 Old Summerville Rd NW
- 637 Old Summerville Rd NW
- 9 Coggins Place NE
- 10 Coggins Place NE
- 12 Coggins Place NE
- BELHAVEN Plan at Northberry
- CALI Plan at Northberry
- ARIA Plan at Northberry
- KERRY Plan at Northberry
- ROBIE Plan at Northberry
- 13 Coggins Place NE
- 7 Orr St NE
- 87 Selman Rd NW
- 1 Babcock Dr NE
- 27 Coggins Place NE
- 29 Coggins Place NE
- 9 Split Branch Ct NE
- 10 Split Branch Ct NE
- 7 Split Branch Ct NE
- 8 Split Branch Ct NE
- 10 Foliage Way NE
- 6 Foliage Way NE
- 16 Treehouse Trail NE Unit 23
- 16 Treehouse Trail NE
- 4 Foliage Way NE
- 6 Split Branch Ct NE
- 3 Sapling Ct NE
- 24 Honeytree Trail NE
- 18 Treehouse Trail NE
- 22 Honeytree Trail NE
- 26 Honeytree Trail NE
- 20 Treehouse Trail NE
- 5 Sapling Ct NE
- 7 Foliage Way NE
- 15 Treehouse Trail NE