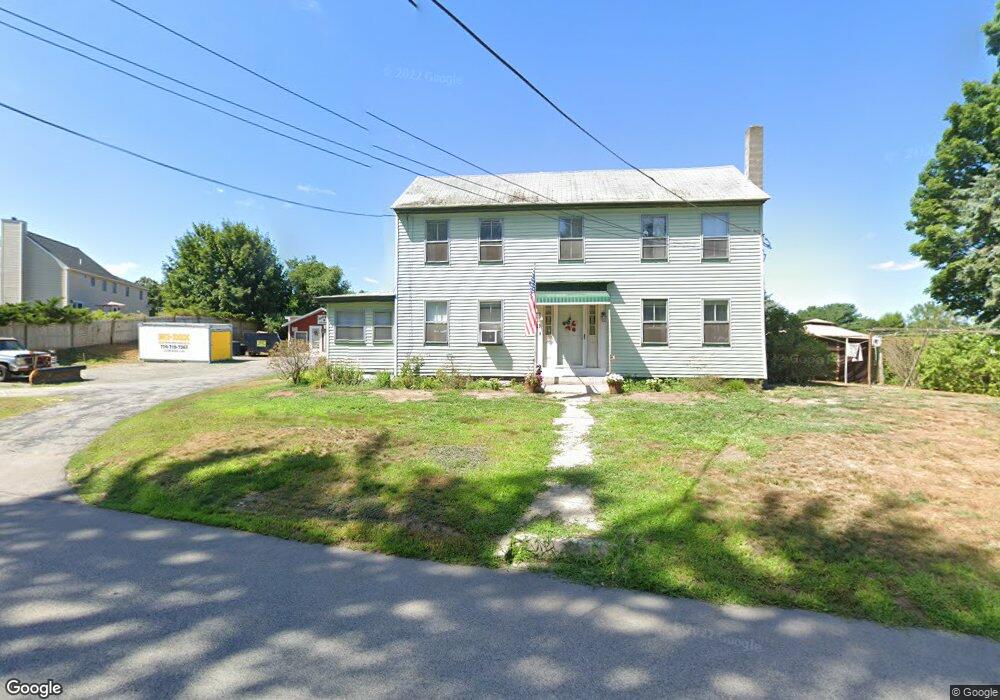
11 Spring Rd Westborough, MA 01581
Estimated Value: $628,000 - $741,000
4
Beds
3
Baths
2,182
Sq Ft
$308/Sq Ft
Est. Value
About This Home
This home is located at 11 Spring Rd, Westborough, MA 01581 and is currently estimated at $672,286, approximately $308 per square foot. 11 Spring Rd is a home located in Worcester County with nearby schools including Westborough High School, Ebridge Montessori School, and Westboro Knowledge Beginnings.
Ownership History
Date
Name
Owned For
Owner Type
Purchase Details
Closed on
Jan 31, 2021
Sold by
Desmarais Lee A
Bought by
Desmarais Lee A and Desmarais Louis R
Current Estimated Value
Purchase Details
Closed on
Jan 5, 2021
Sold by
Parker George E
Bought by
Parker George E and Desmarais Lee A
Purchase Details
Closed on
Feb 17, 1995
Sold by
Listowich Joseph
Bought by
Parker George
Purchase Details
Closed on
Jun 2, 1988
Sold by
Parker George E
Bought by
Parker George E
Home Financials for this Owner
Home Financials are based on the most recent Mortgage that was taken out on this home.
Original Mortgage
$125,000
Interest Rate
10.24%
Mortgage Type
Purchase Money Mortgage
Create a Home Valuation Report for This Property
The Home Valuation Report is an in-depth analysis detailing your home's value as well as a comparison with similar homes in the area
Home Values in the Area
Average Home Value in this Area
Purchase History
| Date | Buyer | Sale Price | Title Company |
|---|---|---|---|
| Desmarais Lee A | -- | None Available | |
| Parker George E | -- | None Available | |
| Parker George | $3,103 | -- | |
| Parker George E | $167,000 | -- |
Source: Public Records
Mortgage History
| Date | Status | Borrower | Loan Amount |
|---|---|---|---|
| Previous Owner | Parker George E | $25,000 | |
| Previous Owner | Parker George E | $182,800 | |
| Previous Owner | Parker George E | $125,000 |
Source: Public Records
Tax History
| Year | Tax Paid | Tax Assessment Tax Assessment Total Assessment is a certain percentage of the fair market value that is determined by local assessors to be the total taxable value of land and additions on the property. | Land | Improvement |
|---|---|---|---|---|
| 2025 | $8,933 | $548,400 | $316,200 | $232,200 |
| 2024 | $8,330 | $507,600 | $294,600 | $213,000 |
| 2023 | $8,107 | $481,400 | $279,700 | $201,700 |
| 2022 | $7,457 | $403,300 | $224,000 | $179,300 |
| 2021 | $3,768 | $363,900 | $200,500 | $163,400 |
| 2020 | $6,810 | $371,700 | $208,300 | $163,400 |
| 2019 | $3,169 | $363,600 | $220,300 | $143,300 |
| 2018 | $6,046 | $327,500 | $205,900 | $121,600 |
| 2017 | $5,586 | $313,800 | $205,900 | $107,900 |
| 2016 | $5,436 | $305,900 | $195,500 | $110,400 |
| 2015 | $5,581 | $300,200 | $195,500 | $104,700 |
Source: Public Records
Map
Nearby Homes
Your Personal Tour Guide
Ask me questions while you tour the home.