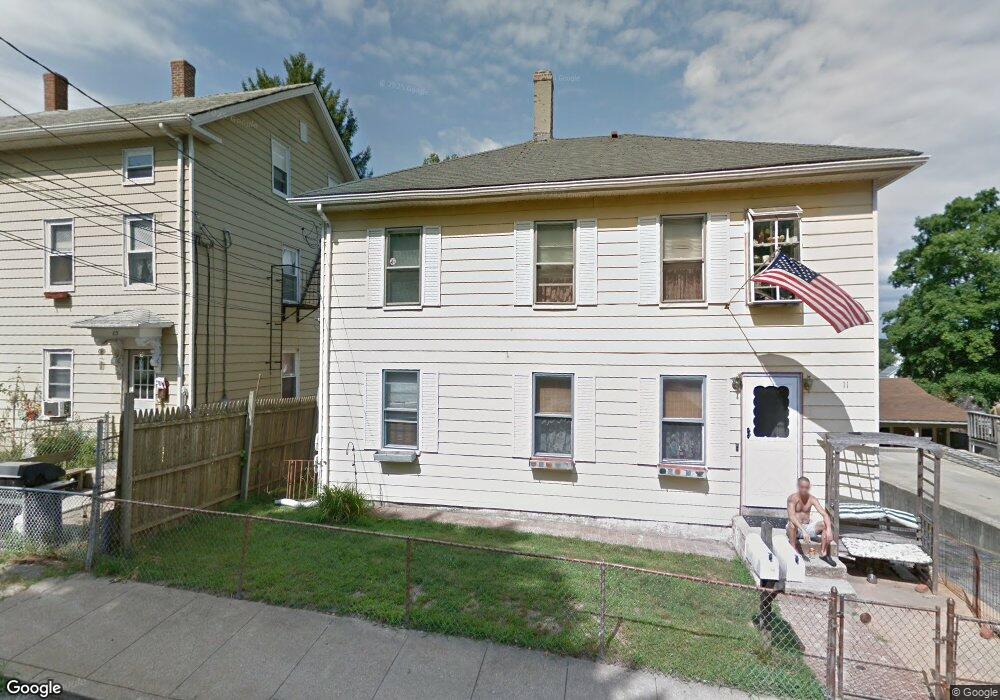
11 Spring St West Warwick, RI 02893
Centreville NeighborhoodEstimated Value: $371,166 - $464,000
4
Beds
2
Baths
1,536
Sq Ft
$281/Sq Ft
Est. Value
About This Home
This home is located at 11 Spring St, West Warwick, RI 02893 and is currently estimated at $431,292, approximately $280 per square foot. 11 Spring St is a home located in Kent County with nearby schools including West Warwick High School.
Ownership History
Date
Name
Owned For
Owner Type
Purchase Details
Closed on
Sep 15, 2020
Sold by
Hadfield Robert W
Bought by
Hadfield Robert W and Hadfield Marguerite L
Current Estimated Value
Purchase Details
Closed on
Aug 24, 2000
Sold by
Lamoureux John
Bought by
Hadfield Robert W
Home Financials for this Owner
Home Financials are based on the most recent Mortgage that was taken out on this home.
Original Mortgage
$73,962
Interest Rate
8.06%
Create a Home Valuation Report for This Property
The Home Valuation Report is an in-depth analysis detailing your home's value as well as a comparison with similar homes in the area
Home Values in the Area
Average Home Value in this Area
Purchase History
| Date | Buyer | Sale Price | Title Company |
|---|---|---|---|
| Hadfield Robert W | -- | None Available | |
| Hadfield Robert W | $109,500 | -- |
Source: Public Records
Mortgage History
| Date | Status | Borrower | Loan Amount |
|---|---|---|---|
| Previous Owner | Hadfield Robert W | $10,000 | |
| Previous Owner | Hadfield Robert W | $93,700 | |
| Previous Owner | Hadfield Robert W | $73,962 |
Source: Public Records
Tax History
| Year | Tax Paid | Tax Assessment Tax Assessment Total Assessment is a certain percentage of the fair market value that is determined by local assessors to be the total taxable value of land and additions on the property. | Land | Improvement |
|---|---|---|---|---|
| 2025 | $4,679 | $327,400 | $75,700 | $251,700 |
| 2024 | $4,086 | $218,600 | $48,100 | $170,500 |
| 2023 | $4,005 | $218,600 | $48,100 | $170,500 |
| 2022 | $3,944 | $218,600 | $48,100 | $170,500 |
| 2021 | $3,475 | $151,100 | $39,500 | $111,600 |
| 2020 | $3,475 | $151,100 | $39,500 | $111,600 |
| 2019 | $4,430 | $151,100 | $39,500 | $111,600 |
| 2018 | $3,403 | $125,200 | $37,100 | $88,100 |
| 2017 | $3,294 | $125,200 | $37,100 | $88,100 |
| 2016 | $3,235 | $125,200 | $37,100 | $88,100 |
| 2015 | $3,136 | $120,800 | $37,100 | $83,700 |
| 2014 | $767 | $120,800 | $37,100 | $83,700 |
Source: Public Records
Map
Nearby Homes
- 2 Teresa Ann Crossing
- 36 Cowesett Ave Unit 5
- 8 Teresa Ann Crossing
- 4 Teresa Ann Crossing
- 6 Teresa Ann Crossing
- 1728 Main St
- 1605 Main St
- 3 June Ct
- 1588 Main St Unit 25
- 21 Carlson Cir
- 131 Pawtuxet Terrace
- 16 Morris St
- 240 Coit Ave
- 19 Turner Dr
- 17 Bellaire Ave
- 165 Lockwood St
- 8 Lenox Ave
- 136 Silverwood Ln
- 91 Windsor Park Dr
- 79 Village Ct
- 13 Spring St
- 7 Spring St
- 7-9 Spring St Unit 7 Spring Unit 2
- 7-9 Spring St Unit 7 Spring unit 1
- 29 Spring St
- 10 Spring St
- 6 Spring St
- 16 School St
- 3 Spring St
- 28 School St
- 14 School St Unit 6
- 14 School St Unit 5
- 14 School St Unit 1
- 14 School St Unit 2
- 14 School St Unit 3
- 14 School St Unit 4
- 22 Spring St
- 20 Spring St
- 27 Spring St
- 16 Spring St
Your Personal Tour Guide
Ask me questions while you tour the home.