11 Stanley Cir Quincy, MA 02169
South Quincy NeighborhoodEstimated Value: $714,000 - $847,000
3
Beds
2
Baths
1,696
Sq Ft
$460/Sq Ft
Est. Value
About This Home
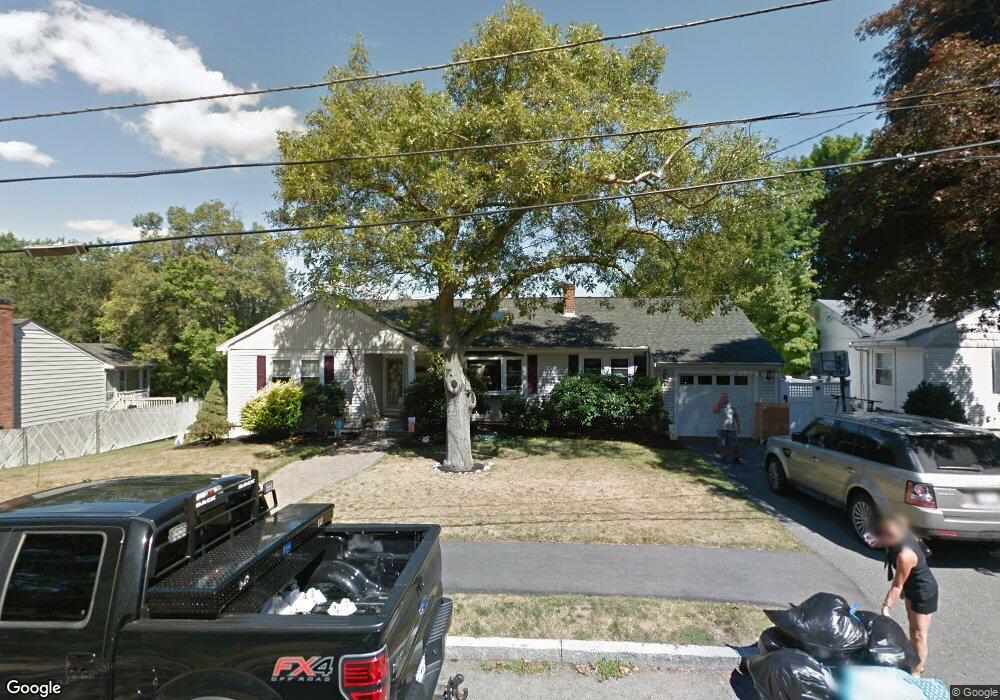
This home is located at 11 Stanley Cir, Quincy, MA 02169 and is currently estimated at $780,555, approximately $460 per square foot. 11 Stanley Cir is a home located in Norfolk County with nearby schools including Lincoln-Hancock Community School, South West Middle School, and Quincy High School.
Ownership History
Date
Name
Owned For
Owner Type
Purchase Details
Closed on
Jun 18, 1991
Sold by
Harrison Exr Camille
Bought by
Colarusso Thomas J and Colarusso Giuliana
Current Estimated Value
Home Financials for this Owner
Home Financials are based on the most recent Mortgage that was taken out on this home.
Original Mortgage
$127,500
Interest Rate
9.39%
Mortgage Type
Purchase Money Mortgage
Create a Home Valuation Report for This Property
The Home Valuation Report is an in-depth analysis detailing your home's value as well as a comparison with similar homes in the area
Home Values in the Area
Average Home Value in this Area
Purchase History
| Date | Buyer | Sale Price | Title Company |
|---|---|---|---|
| Colarusso Thomas J | $160,000 | -- |
Source: Public Records
Mortgage History
| Date | Status | Borrower | Loan Amount |
|---|---|---|---|
| Open | Colarusso Thomas J | $42,000 | |
| Open | Colarusso Thomas J | $142,500 | |
| Closed | Colarusso Thomas J | $127,500 |
Source: Public Records
Tax History Compared to Growth
Tax History
| Year | Tax Paid | Tax Assessment Tax Assessment Total Assessment is a certain percentage of the fair market value that is determined by local assessors to be the total taxable value of land and additions on the property. | Land | Improvement |
|---|---|---|---|---|
| 2025 | $8,055 | $698,600 | $318,200 | $380,400 |
| 2024 | $7,666 | $680,200 | $303,400 | $376,800 |
| 2023 | $7,192 | $646,200 | $276,600 | $369,600 |
| 2022 | $7,335 | $612,300 | $231,800 | $380,500 |
| 2021 | $6,775 | $558,100 | $231,800 | $326,300 |
| 2020 | $6,689 | $538,100 | $231,800 | $306,300 |
| 2019 | $6,552 | $522,100 | $219,200 | $302,900 |
| 2018 | $6,167 | $462,300 | $203,600 | $258,700 |
| 2017 | $5,953 | $420,100 | $194,200 | $225,900 |
| 2016 | $5,435 | $378,500 | $170,000 | $208,500 |
| 2015 | $5,371 | $367,900 | $170,000 | $197,900 |
| 2014 | $5,299 | $356,600 | $170,000 | $186,600 |
Source: Public Records
Map
Nearby Homes
- 5 Pearl St
- 57 Summer St
- 155 Kendrick Ave Unit T7
- 83 Madison Ave
- 34 South St Unit 202
- 8 Jackson St Unit B2
- 72 Federal Ave
- 18 Cliveden St Unit 201W
- 2 Cliveden St Unit 601E
- 2 Cliveden St Unit 305E
- 32 Sumner St
- 35 Sumner St
- 5 Main St
- 145 S Walnut St
- 216 South St
- 72 Main St
- 51 Sumner St
- 123 Elm St Unit D-8
- 36 Bigelow St
- 165 Granite St