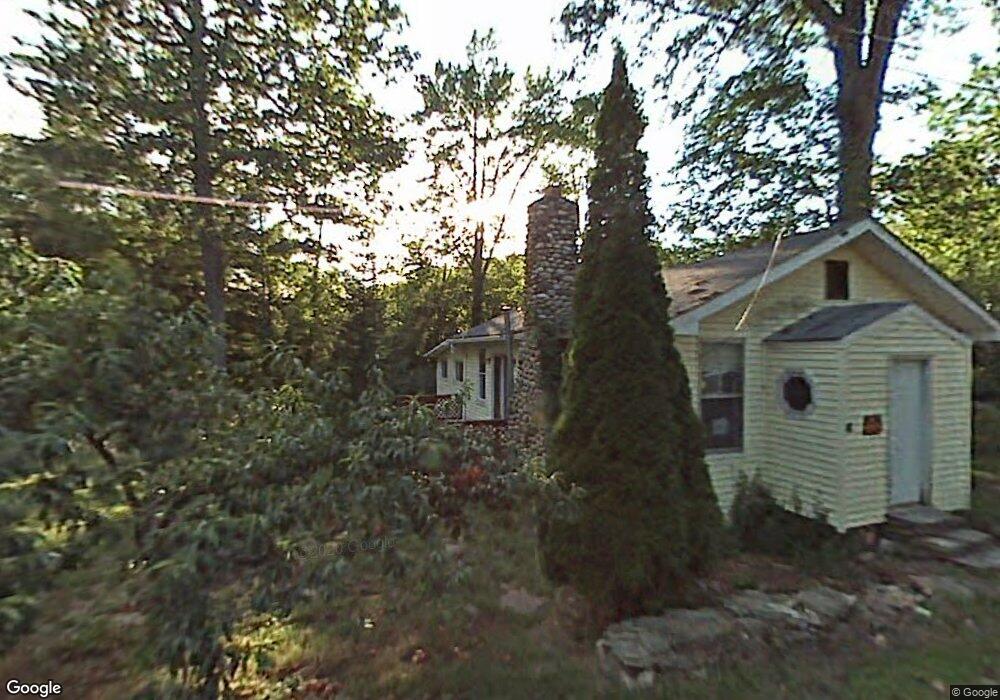
11 Stevens Way Rutland, MA 01543
Estimated Value: $190,000 - $257,000
3
Beds
1
Bath
936
Sq Ft
$253/Sq Ft
Est. Value
About This Home
This home is located at 11 Stevens Way, Rutland, MA 01543 and is currently estimated at $237,105, approximately $253 per square foot. 11 Stevens Way is a home located in Worcester County with nearby schools including Wachusett Regional High School.
Ownership History
Date
Name
Owned For
Owner Type
Purchase Details
Closed on
Dec 22, 2008
Sold by
Fnma
Bought by
Pines Nicholas
Current Estimated Value
Purchase Details
Closed on
Mar 13, 2007
Sold by
Bzdawka Paul A
Bought by
Federal National Mortgage Association
Purchase Details
Closed on
Sep 20, 1996
Sold by
Newby Charles H
Bought by
Bzdawka Paul A
Home Financials for this Owner
Home Financials are based on the most recent Mortgage that was taken out on this home.
Original Mortgage
$20,000
Interest Rate
7.89%
Mortgage Type
Purchase Money Mortgage
Purchase Details
Closed on
Aug 12, 1996
Sold by
First Nb Boston
Bought by
Newby Charles H
Home Financials for this Owner
Home Financials are based on the most recent Mortgage that was taken out on this home.
Original Mortgage
$20,000
Interest Rate
7.89%
Mortgage Type
Purchase Money Mortgage
Create a Home Valuation Report for This Property
The Home Valuation Report is an in-depth analysis detailing your home's value as well as a comparison with similar homes in the area
Home Values in the Area
Average Home Value in this Area
Purchase History
| Date | Buyer | Sale Price | Title Company |
|---|---|---|---|
| Pines Nicholas | $14,900 | -- | |
| Federal National Mortgage Association | $76,415 | -- | |
| Bzdawka Paul A | $20,000 | -- | |
| Newby Charles H | $20,000 | -- |
Source: Public Records
Mortgage History
| Date | Status | Borrower | Loan Amount |
|---|---|---|---|
| Previous Owner | Newby Charles H | $60,000 | |
| Previous Owner | Newby Charles H | $20,000 |
Source: Public Records
Tax History Compared to Growth
Tax History
| Year | Tax Paid | Tax Assessment Tax Assessment Total Assessment is a certain percentage of the fair market value that is determined by local assessors to be the total taxable value of land and additions on the property. | Land | Improvement |
|---|---|---|---|---|
| 2025 | $2,550 | $179,100 | $73,000 | $106,100 |
| 2024 | $2,070 | $139,600 | $64,900 | $74,700 |
| 2023 | $1,815 | $132,300 | $61,200 | $71,100 |
| 2022 | $1,814 | $114,900 | $52,000 | $62,900 |
| 2021 | $1,748 | $104,700 | $51,400 | $53,300 |
| 2020 | $1,583 | $89,900 | $41,700 | $48,200 |
| 2019 | $1,524 | $85,200 | $35,400 | $49,800 |
| 2018 | $1,385 | $76,400 | $35,400 | $41,000 |
| 2017 | $1,400 | $76,400 | $35,400 | $41,000 |
| 2016 | $1,537 | $88,500 | $36,800 | $51,700 |
| 2015 | $1,562 | $88,500 | $36,800 | $51,700 |
| 2014 | $1,514 | $88,500 | $36,800 | $51,700 |
Source: Public Records
Map
Nearby Homes
- 7 Victoria Ave
- 2 Kosta Ave
- 4 Wilson Way
- 14 Welch Ave Unit A
- 7 Emerald Rd
- 236 Turkey Hill Rd
- 289 Richards Ave
- LOT 8 Pierre Cir
- 189 Maple Ave
- 11 Brigham Rd
- 176 Maple Ave Unit 1-38
- 176 Maple Ave Unit 3-25
- 176 Maple Ave Unit 2-26
- 7 Prescott St
- 217 Grove St
- 132 Fidelity Dr Unit 61
- 12 Fidelity Dr Unit 6
- 10 Fidelity Dr Unit 5
- 85 Maple Ave Unit A
- Lot 11 Pleasantdale Rd