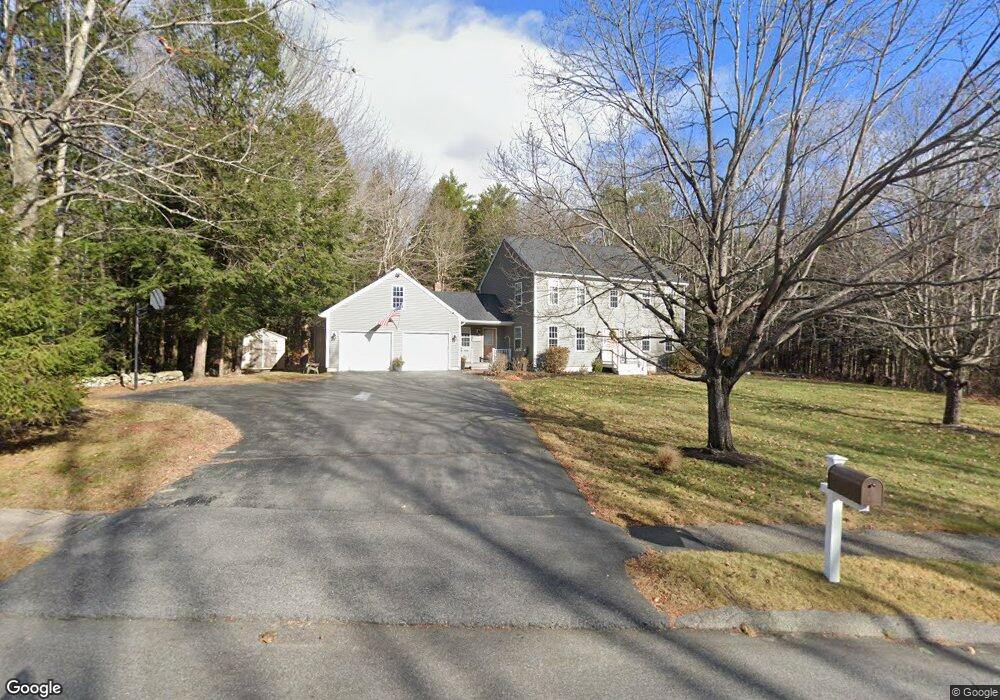
11 Stone Brook Rd Windham, ME 04062
Windham AreaEstimated Value: $603,000 - $668,000
About This Home
This home is located at 11 Stone Brook Rd, Windham, ME 04062 and is currently estimated at $637,249, approximately $288 per square foot. 11 Stone Brook Rd is a home located in Cumberland County with nearby schools including Windham Primary School, Manchester School, and Windham Middle School.
Ownership History
We collect this data history from publicly available records. To have your information removed, we recommend requesting removal directly through your county’s website.
Purchase Details
Home Financials for this Owner
Home Financials are based on the most recent Mortgage that was taken out on this home.Home Values in the Area
Average Home Value in this Area
Purchase History
We collect this data history from publicly available records. To have your information removed, we recommend requesting removal directly through your county’s website.
| Date | Buyer | Sale Price | Title Company |
|---|---|---|---|
| -- | -- |
Mortgage History
We collect this data history from publicly available records. To have your information removed, we recommend requesting removal directly through your county’s website.
| Date | Status | Borrower | Loan Amount |
|---|---|---|---|
| Open | $105,000 | ||
| Open | $307,000 | ||
| Closed | $315,153 | ||
| Previous Owner | $250,000 | ||
| Closed | $250,000 |
Tax History
We collect this data history from publicly available records. To have your information removed, we recommend requesting removal directly through your county’s website.
| Year | Tax Paid | Tax Assessment Tax Assessment Total Assessment is a certain percentage of the fair market value that is determined by local assessors to be the total taxable value of land and additions on the property. | Land | Improvement |
|---|---|---|---|---|
| 2025 | $6,773 | $561,600 | $147,400 | $414,200 |
| 2024 | $6,442 | $561,600 | $147,400 | $414,200 |
| 2023 | $5,972 | $533,200 | $137,100 | $396,100 |
| 2022 | $5,310 | $457,400 | $109,600 | $347,800 |
| 2021 | $4,697 | $372,800 | $84,100 | $288,700 |
| 2020 | $4,949 | $329,900 | $79,900 | $250,000 |
| 2019 | $4,830 | $329,900 | $79,900 | $250,000 |
| 2018 | $4,641 | $305,700 | $74,100 | $231,600 |
| 2017 | $4,632 | $281,900 | $66,300 | $215,600 |
| 2016 | $4,187 | $266,700 | $66,300 | $200,400 |
| 2015 | $4,041 | $266,700 | $66,300 | $200,400 |
| 2014 | $3,766 | $266,700 | $66,300 | $200,400 |
| 2013 | -- | $266,700 | $66,300 | $200,400 |
Map
- 7 Birdsong Ln
- 80 Vista Dr
- 1 Vista Dr
- 3 Frenchmans Ln
- 53 Johnson Rd
- 305 Windham Center Rd
- 8 Environmental Way
- 44 Johnson Rd
- 27 Independence Dr
- 38 Lantern Ln
- 26 Dolley Farm Rd Unit 12
- 10 Charlan Ln
- Lot 44 -A
- 81 Babbidge Rd
- 14 Scout Ln
- 38 Lakeside Dr
- 1 Marzilli Way
- 6 Dolley Farm Rd Unit 3
- 93 Rockaway Rd
- 7 Magnolia Ln Unit 2
- 11 Stonebrook Estate
- 11 Stonebrook Rd
- 15 Stone Brook Rd
- 15 Stonebrook Rd
- 0 Stonebrook Rd
- 7 Stone Brook Rd
- 14 Fox Run
- 7 Stonebrook Rd
- 138 Albion Rd
- 14 Stonebrook Rd
- 18 Stone Brook Rd
- 10 Stone Brook Rd
- 10 Stone Brook Rd
- 14 Stone Brook Rd
- 3 Stone Brook Rd
- 19 Stonebrook Rd
- 18 Fox Run
- 12 Stonebrook Estates
- 19 Stone Brook Rd
- 6 Stone Brook Rd
Ask me questions while you tour the home.