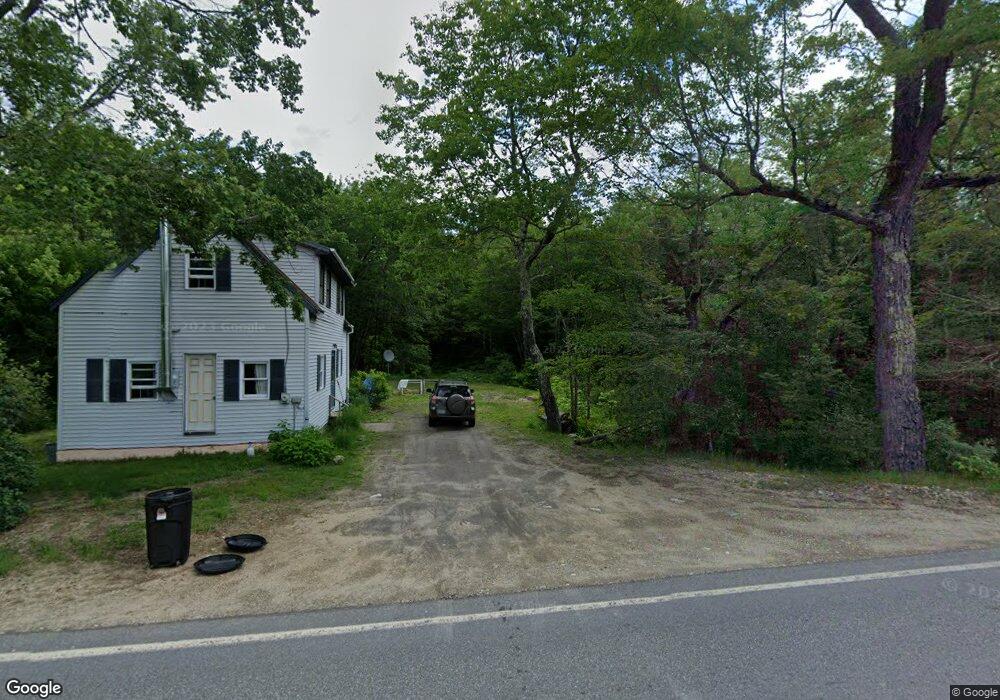
11 Stone View Dr Hartford, ME 04220
Estimated Value: $355,529 - $614,000
3
Beds
1
Bath
--
Sq Ft
15
Acres
About This Home
This home is located at 11 Stone View Dr, Hartford, ME 04220 and is currently estimated at $508,132. 11 Stone View Dr is a home with nearby schools including Hartford-Sumner Elementary School and Buckfield Junior/Senior High School.
Ownership History
Date
Name
Owned For
Owner Type
Purchase Details
Closed on
Oct 7, 2014
Sold by
Shaw Warren S
Bought by
Shaw Warren S and Shaw Amy B
Current Estimated Value
Create a Home Valuation Report for This Property
The Home Valuation Report is an in-depth analysis detailing your home's value as well as a comparison with similar homes in the area
Home Values in the Area
Average Home Value in this Area
Purchase History
| Date | Buyer | Sale Price | Title Company |
|---|---|---|---|
| Shaw Warren S | -- | -- |
Source: Public Records
Tax History Compared to Growth
Tax History
| Year | Tax Paid | Tax Assessment Tax Assessment Total Assessment is a certain percentage of the fair market value that is determined by local assessors to be the total taxable value of land and additions on the property. | Land | Improvement |
|---|---|---|---|---|
| 2024 | $5,182 | $269,196 | $52,500 | $216,696 |
| 2023 | $5,222 | $269,196 | $52,500 | $216,696 |
| 2022 | $5,222 | $269,196 | $52,500 | $216,696 |
| 2021 | $2,823 | $144,760 | $38,500 | $106,260 |
| 2020 | $2,736 | $144,760 | $38,500 | $106,260 |
| 2019 | $2,750 | $144,760 | $38,500 | $106,260 |
| 2018 | $2,772 | $144,760 | $38,500 | $106,260 |
| 2017 | $2,548 | $144,760 | $38,500 | $106,260 |
| 2016 | $2,737 | $147,942 | $30,300 | $117,642 |
| 2015 | $2,619 | $147,942 | $30,300 | $117,642 |
| 2013 | $2,542 | $145,263 | $30,300 | $114,963 |
Source: Public Records
Map
Nearby Homes
- 21 Jones Dr
- 2539 Auburn Rd
- 7 Dakin Rd
- 12 Moore Ln
- 8 Moore Ln
- 18 Thurlow Dr
- 67 Deer Rd
- 167 Howes Corner Rd
- Lot C Fern Way
- Lot16 Torrey Hill Rd
- 209 Howes Corner Rd
- 1785 Federal Rd
- Lot 45-8 Wyatt's Way
- 1729
- 1671 Federal Rd
- 410 Pleasant Pond Rd
- 8 Buck Ln
- 574 Howes Corner Rd
- 46 Appleseed Dr
- 77 Appleseed Dr