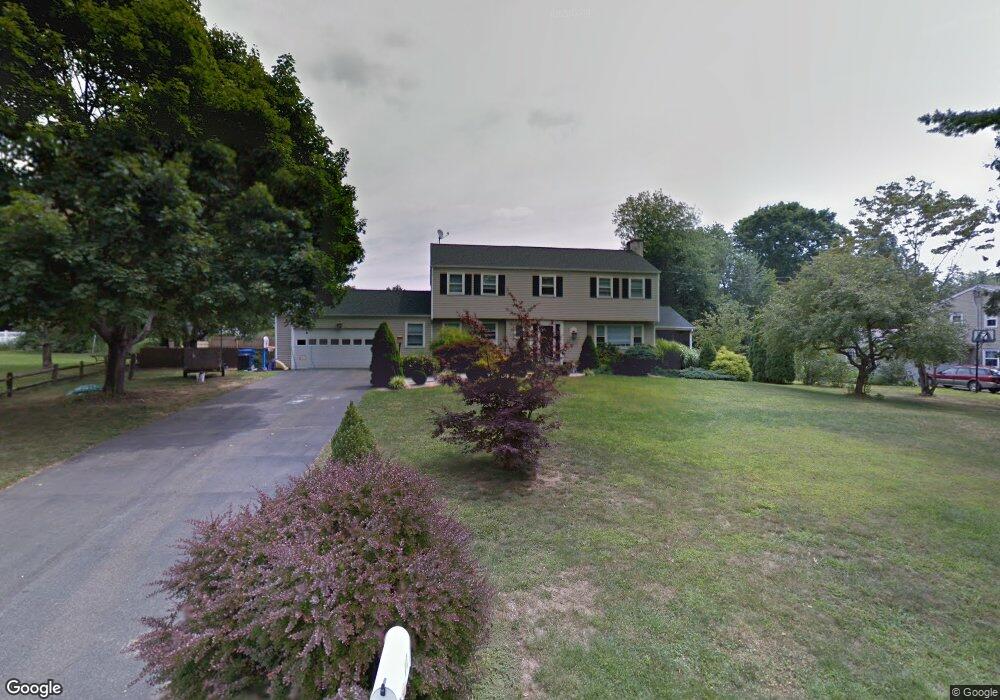
11 Stonewall Ln Guilford, CT 06437
Estimated Value: $649,000 - $681,000
4
Beds
3
Baths
2,453
Sq Ft
$270/Sq Ft
Est. Value
About This Home
This home is located at 11 Stonewall Ln, Guilford, CT 06437 and is currently estimated at $661,349, approximately $269 per square foot. 11 Stonewall Ln is a home located in New Haven County with nearby schools including E.C. Adams Middle School, A. Baldwin Middle School, and Guilford High School.
Ownership History
Date
Name
Owned For
Owner Type
Purchase Details
Closed on
Sep 16, 2011
Sold by
Matlosz Mark D and Gross Alexandra M
Bought by
Gross Alexandra M
Current Estimated Value
Purchase Details
Closed on
Oct 26, 2004
Sold by
Obuck Matthew P and Obuck Maureen K
Bought by
Gross Alexandra M and Matlosz Mark D
Home Financials for this Owner
Home Financials are based on the most recent Mortgage that was taken out on this home.
Original Mortgage
$355,500
Interest Rate
5.85%
Purchase Details
Closed on
Sep 2, 1997
Sold by
Gustafson Robert W and Gustafson Barbara H
Bought by
Obuck Matthew P and Obuck Maureen K
Home Financials for this Owner
Home Financials are based on the most recent Mortgage that was taken out on this home.
Original Mortgage
$181,200
Interest Rate
7.83%
Mortgage Type
Unknown
Create a Home Valuation Report for This Property
The Home Valuation Report is an in-depth analysis detailing your home's value as well as a comparison with similar homes in the area
Home Values in the Area
Average Home Value in this Area
Purchase History
| Date | Buyer | Sale Price | Title Company |
|---|---|---|---|
| Gross Alexandra M | -- | -- | |
| Gross Alexandra M | $395,000 | -- | |
| Obuck Matthew P | $226,500 | -- |
Source: Public Records
Mortgage History
| Date | Status | Borrower | Loan Amount |
|---|---|---|---|
| Open | Obuck Matthew P | $320,000 | |
| Previous Owner | Obuck Matthew P | $15,000 | |
| Previous Owner | Obuck Matthew P | $355,500 | |
| Previous Owner | Obuck Matthew P | $181,200 |
Source: Public Records
Tax History Compared to Growth
Tax History
| Year | Tax Paid | Tax Assessment Tax Assessment Total Assessment is a certain percentage of the fair market value that is determined by local assessors to be the total taxable value of land and additions on the property. | Land | Improvement |
|---|---|---|---|---|
| 2025 | $9,194 | $332,500 | $171,500 | $161,000 |
| 2024 | $8,838 | $332,500 | $171,500 | $161,000 |
| 2023 | $8,605 | $332,500 | $171,500 | $161,000 |
| 2022 | $7,920 | $238,190 | $141,400 | $96,790 |
| 2021 | $7,770 | $238,190 | $141,400 | $96,790 |
| 2020 | $7,670 | $237,400 | $141,400 | $96,000 |
| 2019 | $7,604 | $237,400 | $141,400 | $96,000 |
| 2018 | $7,426 | $237,400 | $141,400 | $96,000 |
| 2017 | $7,826 | $266,560 | $151,200 | $115,360 |
| 2016 | $7,642 | $266,560 | $151,200 | $115,360 |
| 2015 | $7,528 | $266,560 | $151,200 | $115,360 |
| 2014 | $7,309 | $266,560 | $151,200 | $115,360 |
Source: Public Records
Map
Nearby Homes
- 42 Horseshoe Rd
- 104 Sperry Dr
- 360 E River Rd
- 195 Tanner Marsh Rd
- 90 Boston Post Rd
- 108 Boston Post Rd
- 3 Arrowhead Rd
- 333 Clapboard Hill Rd
- 324 Tanner Marsh Rd
- 505 Old Whitfield St
- 22 Village Cir Unit 22
- 33 Village Walk Unit 33
- 41 Allison Dr
- 52 Seaside Ave
- 405 Whitfield St Unit 2
- 51 Pearl St
- 9 Old Farms Rd
- 15 Highland Terrace
- 29 Circle Beach Rd
- 379 Whitfield St Unit CN946