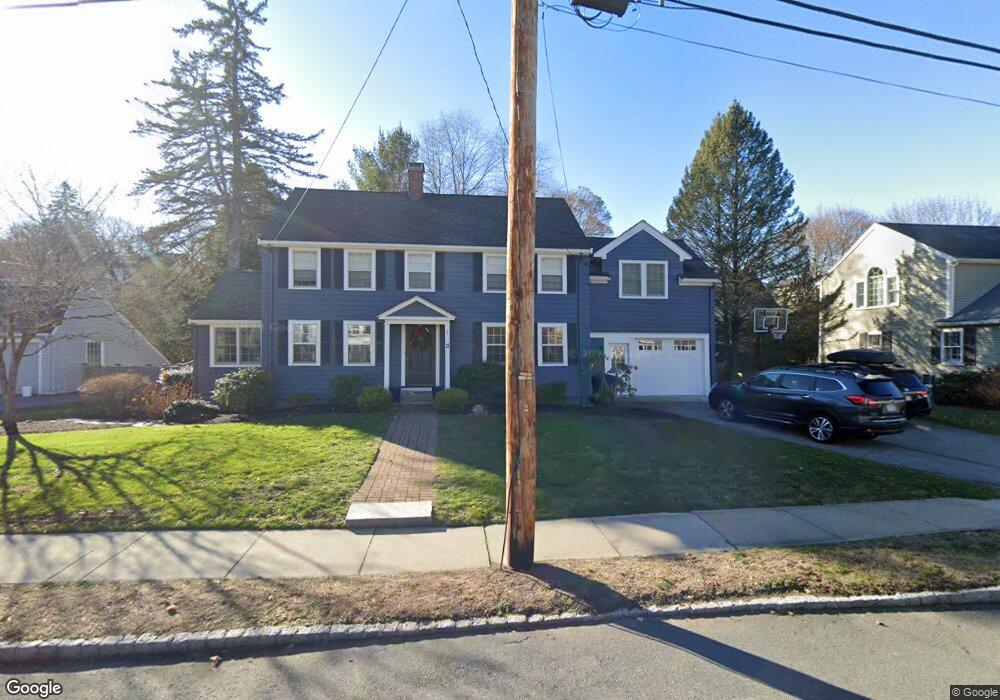
11 Stowell Rd Winchester, MA 01890
Symmes Corner NeighborhoodEstimated Value: $1,840,000 - $2,116,000
4
Beds
2
Baths
2,495
Sq Ft
$793/Sq Ft
Est. Value
About This Home
This home is located at 11 Stowell Rd, Winchester, MA 01890 and is currently estimated at $1,977,977, approximately $792 per square foot. 11 Stowell Rd is a home located in Middlesex County with nearby schools including Lincoln Elementary School, McCall Middle School, and Winchester High School.
Ownership History
Date
Name
Owned For
Owner Type
Purchase Details
Closed on
Nov 16, 2010
Sold by
Desimone Frederick C and Desimone Lara B
Bought by
Rollins Thomas W and Rollins Laura D
Current Estimated Value
Home Financials for this Owner
Home Financials are based on the most recent Mortgage that was taken out on this home.
Original Mortgage
$695,200
Outstanding Balance
$458,758
Interest Rate
4.35%
Mortgage Type
Purchase Money Mortgage
Estimated Equity
$1,519,219
Purchase Details
Closed on
May 18, 2005
Sold by
Crescent Nt
Bought by
Lubetsky Benjamin and Brett Jennifer R
Create a Home Valuation Report for This Property
The Home Valuation Report is an in-depth analysis detailing your home's value as well as a comparison with similar homes in the area
Home Values in the Area
Average Home Value in this Area
Purchase History
| Date | Buyer | Sale Price | Title Company |
|---|---|---|---|
| Rollins Thomas W | $869,000 | -- | |
| Lubetsky Benjamin | -- | -- |
Source: Public Records
Mortgage History
| Date | Status | Borrower | Loan Amount |
|---|---|---|---|
| Open | Rollins Thomas W | $695,200 |
Source: Public Records
Tax History Compared to Growth
Tax History
| Year | Tax Paid | Tax Assessment Tax Assessment Total Assessment is a certain percentage of the fair market value that is determined by local assessors to be the total taxable value of land and additions on the property. | Land | Improvement |
|---|---|---|---|---|
| 2025 | $174 | $1,564,600 | $924,000 | $640,600 |
| 2024 | $16,435 | $1,450,600 | $858,000 | $592,600 |
| 2023 | $16,135 | $1,367,400 | $792,000 | $575,400 |
| 2022 | $15,484 | $1,237,700 | $693,000 | $544,700 |
| 2021 | $15,139 | $1,180,000 | $635,300 | $544,700 |
| 2020 | $14,761 | $1,191,400 | $635,300 | $556,100 |
| 2019 | $13,429 | $1,108,900 | $552,800 | $556,100 |
| 2018 | $12,952 | $1,062,500 | $526,400 | $536,100 |
| 2017 | $12,669 | $1,031,700 | $526,400 | $505,300 |
| 2016 | $11,870 | $1,016,300 | $526,400 | $489,900 |
| 2015 | $10,159 | $836,800 | $478,500 | $358,300 |
| 2014 | $9,785 | $772,900 | $400,100 | $372,800 |
Source: Public Records
Map
Nearby Homes
- 446 Highland Ave
- 5 Bacon St
- 77A Brooks St
- 19 Town Way
- 8 Felsdale Close
- 26 North Gateway
- 39 Town Way
- 30 Prospect St
- 9 Lakeview Terrace
- 12 Canterbury Rd
- 20 Grove Place
- 53 Bacon St
- 2 Everett Ave
- 5 Norwich Cir
- 46 Church St
- 595 Winthrop St
- 10 Apache Trail
- 19 Glengarry Rd
- 6 Wyman Ct Unit 6
- 4 Wyman Ct Unit 4