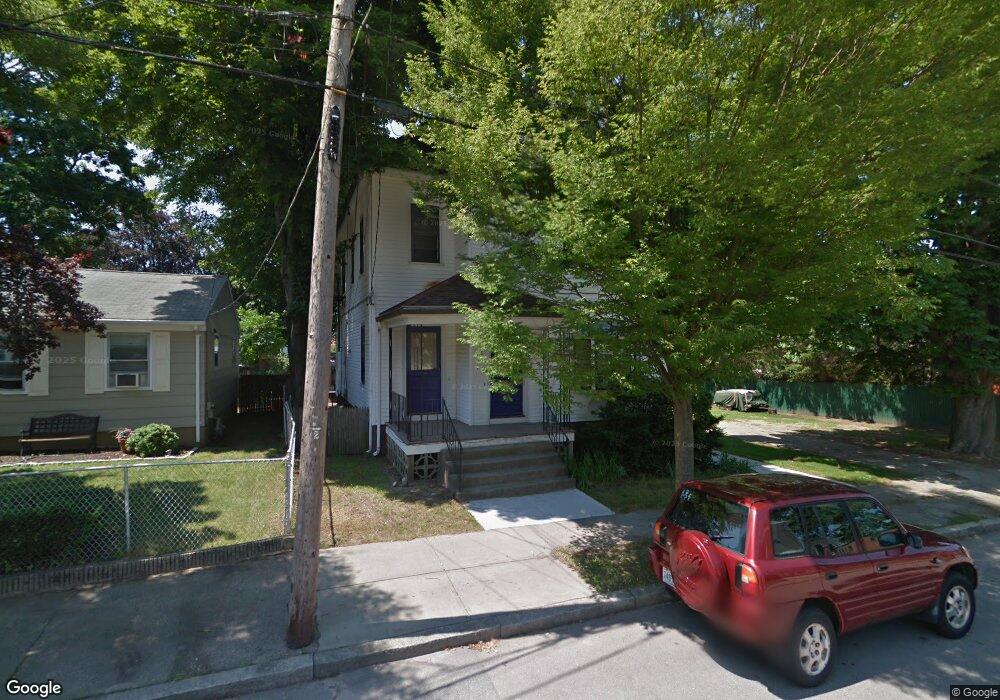
11 Stuart St Pawtucket, RI 02860
Woodlawn NeighborhoodEstimated Value: $467,960 - $589,000
1
Bed
3
Baths
675
Sq Ft
$812/Sq Ft
Est. Value
About This Home
This home is located at 11 Stuart St, Pawtucket, RI 02860 and is currently estimated at $548,240, approximately $812 per square foot. 11 Stuart St is a home located in Providence County with nearby schools including International Charter School, Blackstone Academy Charter School, and Ocean Tides School.
Ownership History
Date
Name
Owned For
Owner Type
Purchase Details
Closed on
Jul 25, 2024
Sold by
Miller Denise and Ricci Benjamin
Bought by
Ricci-Miller Irt and Miller
Current Estimated Value
Purchase Details
Closed on
Oct 8, 2021
Sold by
Miller Denise
Bought by
Miller Denise and Ricci Benjamin
Purchase Details
Closed on
Sep 7, 2017
Sold by
Griffin Jennifer L
Bought by
Miller Denise
Home Financials for this Owner
Home Financials are based on the most recent Mortgage that was taken out on this home.
Original Mortgage
$205,000
Interest Rate
3.92%
Mortgage Type
New Conventional
Create a Home Valuation Report for This Property
The Home Valuation Report is an in-depth analysis detailing your home's value as well as a comparison with similar homes in the area
Home Values in the Area
Average Home Value in this Area
Purchase History
| Date | Buyer | Sale Price | Title Company |
|---|---|---|---|
| Ricci-Miller Irt | -- | None Available | |
| Ricci-Miller Irt | -- | None Available | |
| Miller Denise | -- | None Available | |
| Miller Denise | -- | None Available | |
| Miller Denise | $220,000 | -- | |
| Miller Denise | $220,000 | -- |
Source: Public Records
Mortgage History
| Date | Status | Borrower | Loan Amount |
|---|---|---|---|
| Previous Owner | Miller Denise | $205,000 |
Source: Public Records
Tax History
| Year | Tax Paid | Tax Assessment Tax Assessment Total Assessment is a certain percentage of the fair market value that is determined by local assessors to be the total taxable value of land and additions on the property. | Land | Improvement |
|---|---|---|---|---|
| 2025 | $6,128 | $466,000 | $125,700 | $340,300 |
| 2024 | $5,750 | $466,000 | $125,700 | $340,300 |
| 2023 | $4,428 | $261,400 | $56,600 | $204,800 |
| 2022 | $4,334 | $261,400 | $56,600 | $204,800 |
| 2021 | $4,334 | $261,400 | $56,600 | $204,800 |
| 2020 | $3,927 | $188,000 | $57,300 | $130,700 |
| 2019 | $3,927 | $188,000 | $57,300 | $130,700 |
| 2018 | $3,784 | $188,000 | $57,300 | $130,700 |
| 2017 | $3,635 | $160,000 | $44,400 | $115,600 |
| 2016 | $3,502 | $160,000 | $44,400 | $115,600 |
| 2015 | $3,502 | $160,000 | $44,400 | $115,600 |
| 2014 | $3,242 | $140,600 | $57,000 | $83,600 |
Source: Public Records
Map
Nearby Homes
Your Personal Tour Guide
Ask me questions while you tour the home.