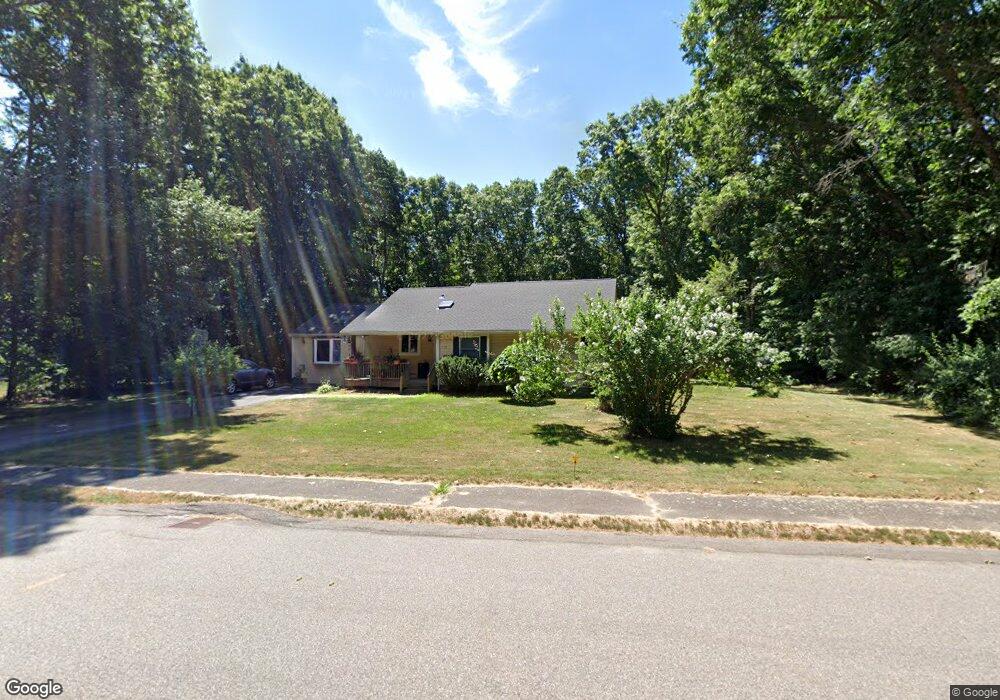
11 Summer Hill Rd Medway, MA 02053
Estimated Value: $623,631 - $743,000
3
Beds
2
Baths
1,695
Sq Ft
$408/Sq Ft
Est. Value
About This Home
This home is located at 11 Summer Hill Rd, Medway, MA 02053 and is currently estimated at $691,158, approximately $407 per square foot. 11 Summer Hill Rd is a home located in Norfolk County with nearby schools including John D. McGovern Elementary School, Burke-Memorial Elementary, and Medway Middle School.
Ownership History
Date
Name
Owned For
Owner Type
Purchase Details
Closed on
May 27, 2011
Sold by
Misiph Stefani B and Misiph Joshua L
Bought by
Quinn Kevin and Signorelli Andrea
Current Estimated Value
Home Financials for this Owner
Home Financials are based on the most recent Mortgage that was taken out on this home.
Original Mortgage
$288,000
Outstanding Balance
$201,405
Interest Rate
4.94%
Mortgage Type
Purchase Money Mortgage
Estimated Equity
$489,753
Purchase Details
Closed on
Jun 7, 2007
Sold by
Patel Kanu S and Patel Lalita K
Bought by
Misiph Joshua L and Misiph Stefani B
Home Financials for this Owner
Home Financials are based on the most recent Mortgage that was taken out on this home.
Original Mortgage
$264,000
Interest Rate
6.17%
Mortgage Type
Purchase Money Mortgage
Create a Home Valuation Report for This Property
The Home Valuation Report is an in-depth analysis detailing your home's value as well as a comparison with similar homes in the area
Home Values in the Area
Average Home Value in this Area
Purchase History
| Date | Buyer | Sale Price | Title Company |
|---|---|---|---|
| Quinn Kevin | $320,000 | -- | |
| Misiph Joshua L | $330,000 | -- |
Source: Public Records
Mortgage History
| Date | Status | Borrower | Loan Amount |
|---|---|---|---|
| Open | Quinn Kevin | $288,000 | |
| Previous Owner | Misiph Joshua L | $264,000 |
Source: Public Records
Tax History Compared to Growth
Tax History
| Year | Tax Paid | Tax Assessment Tax Assessment Total Assessment is a certain percentage of the fair market value that is determined by local assessors to be the total taxable value of land and additions on the property. | Land | Improvement |
|---|---|---|---|---|
| 2025 | $7,602 | $533,500 | $305,600 | $227,900 |
| 2024 | $7,682 | $533,500 | $305,600 | $227,900 |
| 2023 | $7,195 | $451,400 | $253,300 | $198,100 |
| 2022 | $7,163 | $423,100 | $225,000 | $198,100 |
| 2021 | $7,061 | $404,400 | $207,600 | $196,800 |
| 2020 | $6,811 | $389,200 | $192,400 | $196,800 |
| 2019 | $6,516 | $384,000 | $192,400 | $191,600 |
| 2018 | $6,628 | $375,300 | $183,700 | $191,600 |
| 2017 | $6,448 | $359,800 | $177,100 | $182,700 |
| 2016 | $6,398 | $353,300 | $170,600 | $182,700 |
| 2015 | $5,778 | $316,800 | $157,500 | $159,300 |
| 2014 | $5,531 | $293,600 | $158,200 | $135,400 |
Source: Public Records
Map
Nearby Homes