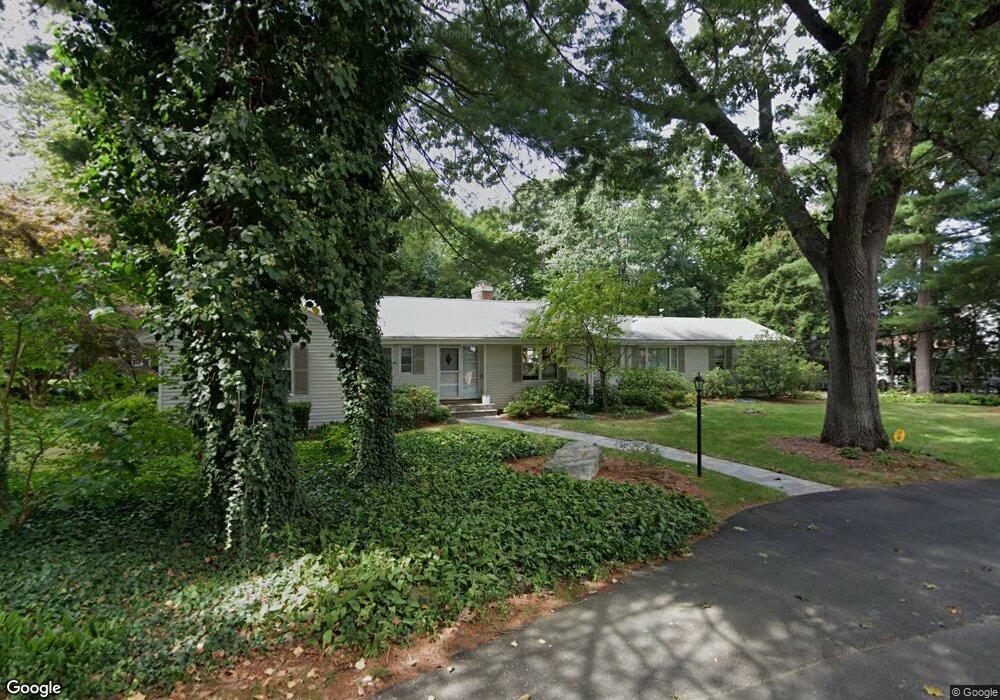
11 Summit Rd Lexington, MA 02421
Follen Heights NeighborhoodEstimated Value: $1,284,000 - $1,988,000
3
Beds
5
Baths
1,928
Sq Ft
$881/Sq Ft
Est. Value
About This Home
This home is located at 11 Summit Rd, Lexington, MA 02421 and is currently estimated at $1,699,523, approximately $881 per square foot. 11 Summit Rd is a home located in Middlesex County with nearby schools including Bowman Elementary School, Jonas Clarke Middle School, and Lexington High School.
Ownership History
Date
Name
Owned For
Owner Type
Purchase Details
Closed on
Aug 1, 2025
Sold by
Behar Linda L
Bought by
11 Summit Road Rt and Behar
Current Estimated Value
Purchase Details
Closed on
Mar 27, 1990
Sold by
Lucas Jason E
Bought by
Behar Kenneth A
Home Financials for this Owner
Home Financials are based on the most recent Mortgage that was taken out on this home.
Original Mortgage
$150,000
Interest Rate
10.15%
Mortgage Type
Purchase Money Mortgage
Create a Home Valuation Report for This Property
The Home Valuation Report is an in-depth analysis detailing your home's value as well as a comparison with similar homes in the area
Home Values in the Area
Average Home Value in this Area
Purchase History
| Date | Buyer | Sale Price | Title Company |
|---|---|---|---|
| 11 Summit Road Rt | -- | -- | |
| 11 Summit Road Rt | -- | -- | |
| Behar Kenneth A | $385,000 | -- | |
| Behar Kenneth A | $385,000 | -- |
Source: Public Records
Mortgage History
| Date | Status | Borrower | Loan Amount |
|---|---|---|---|
| Previous Owner | Behar Kenneth A | $90,000 | |
| Previous Owner | Behar Kenneth A | $150,000 |
Source: Public Records
Tax History
| Year | Tax Paid | Tax Assessment Tax Assessment Total Assessment is a certain percentage of the fair market value that is determined by local assessors to be the total taxable value of land and additions on the property. | Land | Improvement |
|---|---|---|---|---|
| 2025 | $19,360 | $1,583,000 | $1,120,000 | $463,000 |
| 2024 | $18,596 | $1,518,000 | $1,067,000 | $451,000 |
| 2023 | $18,070 | $1,390,000 | $970,000 | $420,000 |
| 2022 | $17,209 | $1,247,000 | $881,000 | $366,000 |
| 2021 | $0 | $1,173,000 | $839,000 | $334,000 |
| 2020 | $16,270 | $1,158,000 | $839,000 | $319,000 |
| 2019 | $15,348 | $1,087,000 | $799,000 | $288,000 |
| 2018 | $4,540 | $1,018,000 | $740,000 | $278,000 |
| 2017 | $4,465 | $973,000 | $705,000 | $268,000 |
| 2016 | $13,505 | $925,000 | $647,000 | $278,000 |
| 2015 | $12,482 | $840,000 | $589,000 | $251,000 |
| 2014 | $11,741 | $757,000 | $527,000 | $230,000 |
Source: Public Records
Map
Nearby Homes
Your Personal Tour Guide
Ask me questions while you tour the home.